NoneBot Status Overview
NoneBot Status Overview Dashboard provided by nonebot-plugin-prometheus source: https://github.com/suyiiyii/nonebot-plugin-prometheus
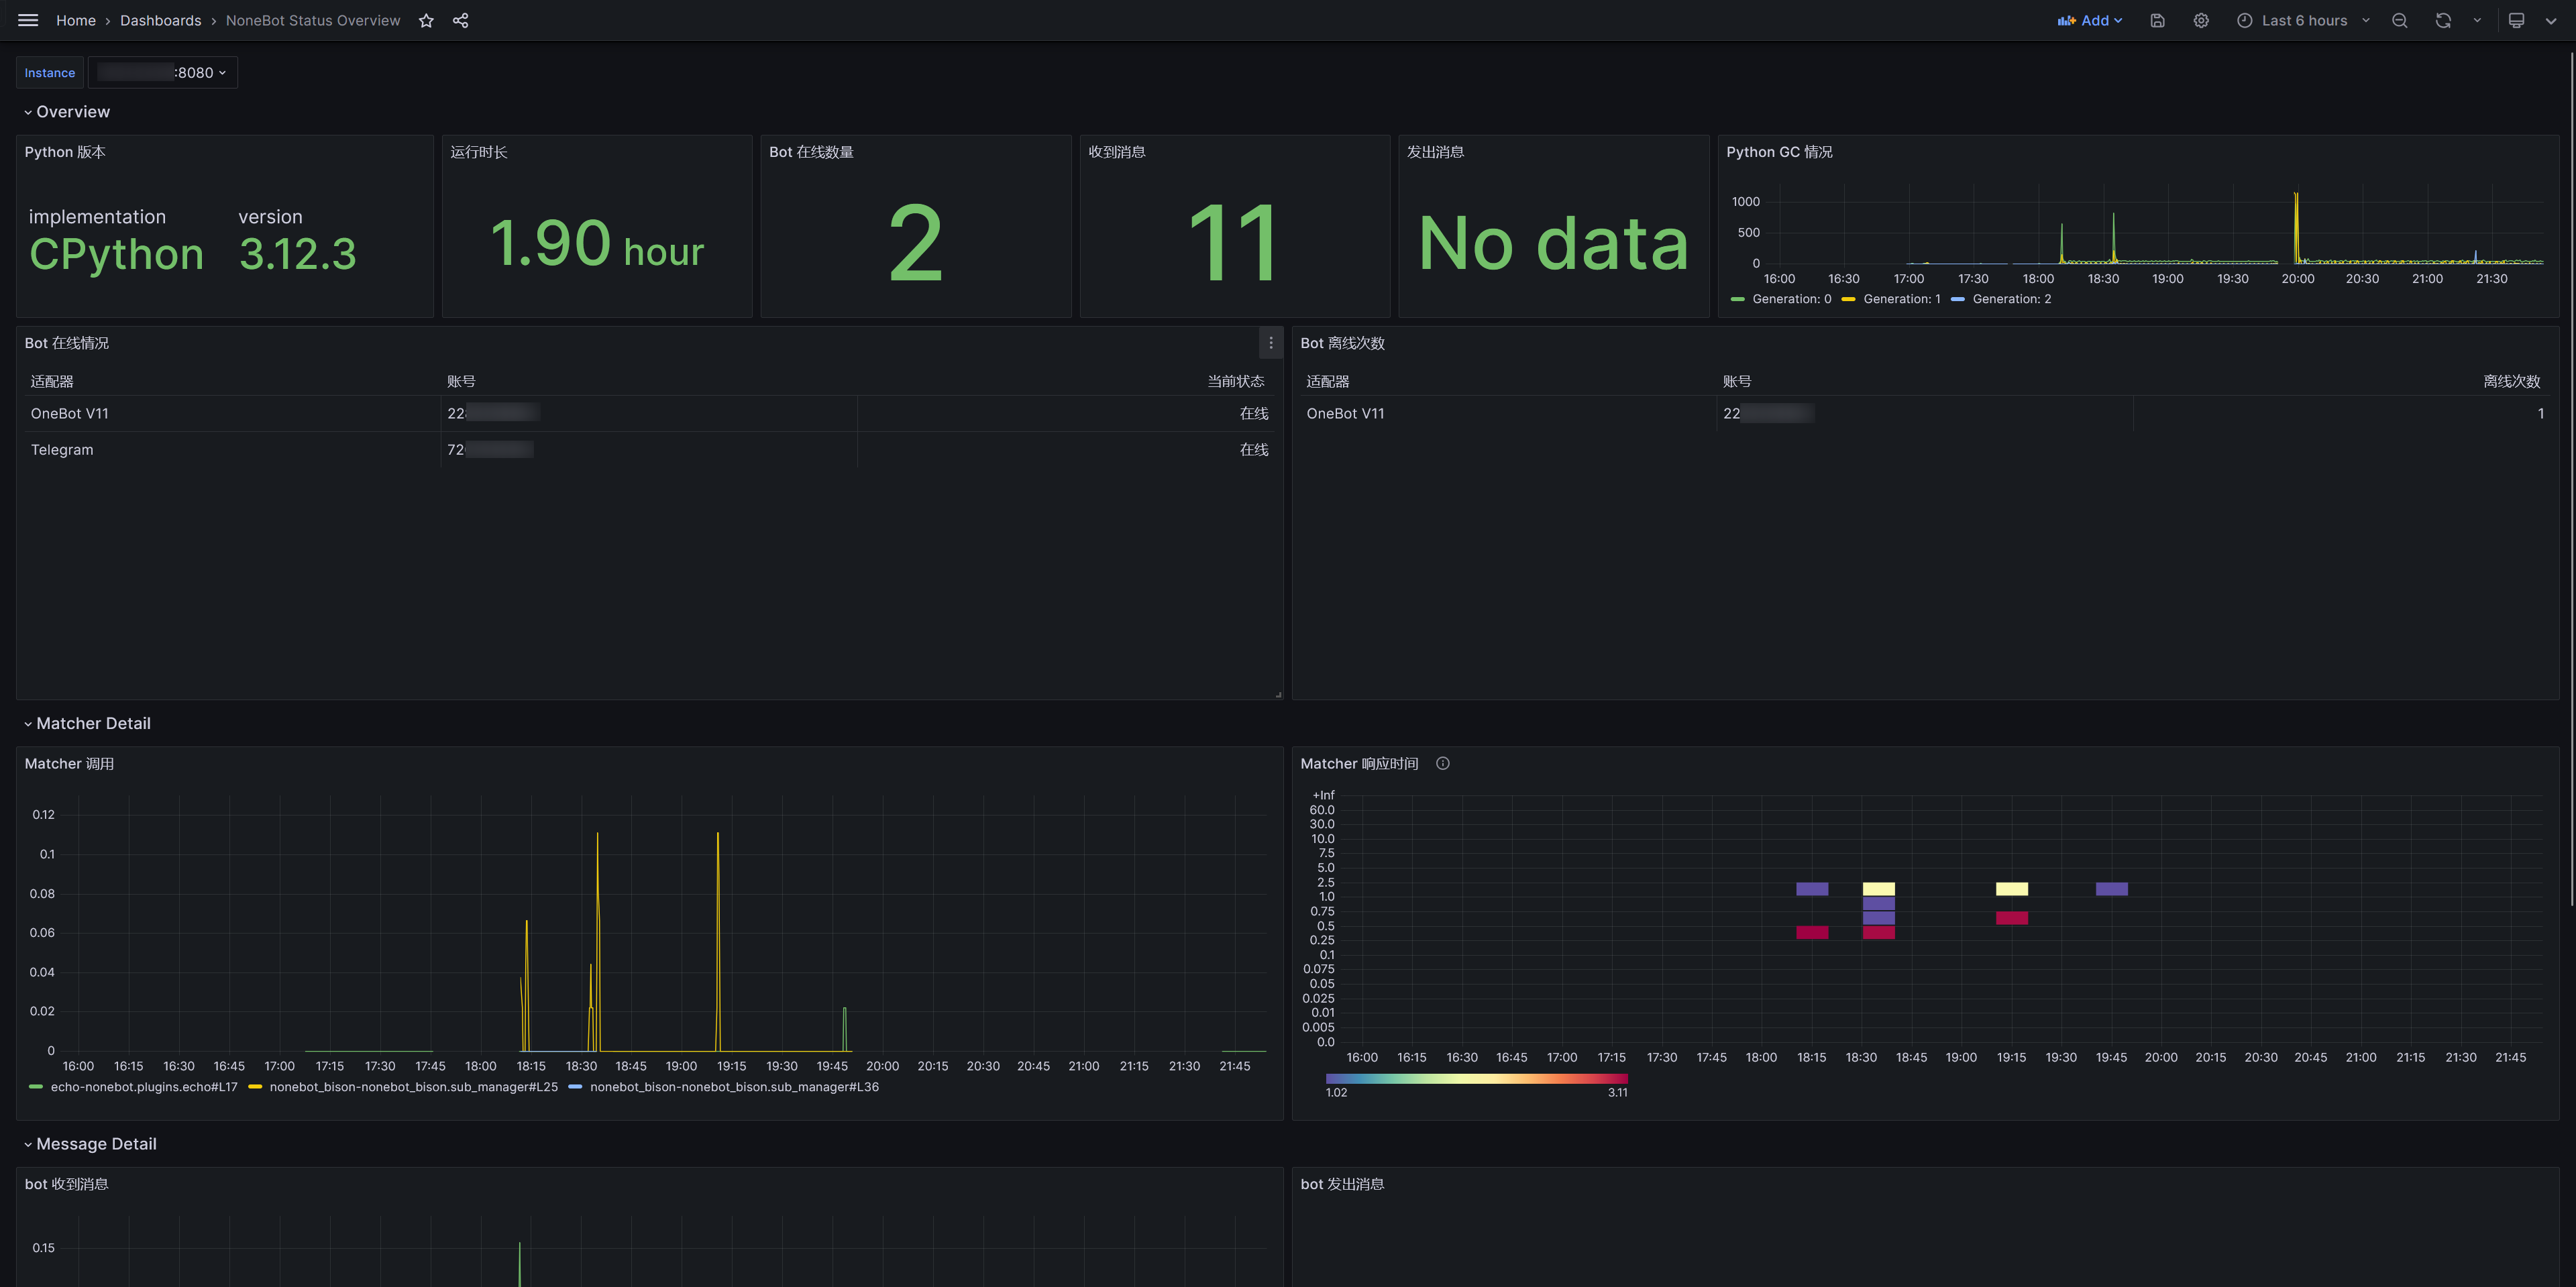
The NoneBot Status Overview dashboard uses the prometheus data source to create a Grafana dashboard with the heatmap, stat, table and timeseries panels.
Data source config
Collector type:
Collector plugins:
Collector config:
Revisions
Upload an updated version of an exported dashboard.json file from Grafana
| Revision | Description | Created | |
|---|---|---|---|
| Download |