VictoriaMetrics - vmanomaly - anomaly statistics
Anomaly statistic dashboard for VictoriaMetrics Anomaly Detection (vmanomaly) v1.19.2 or higher

VictoriaMetrics Anomaly Detection (vmanomaly) score overview
Requirements
vmanomaly: Each revision may require a different version of vmanomaly. Current recommended version - 1.19.2 or higher
Grafana: Each revision may require a different version of Grafana.
For additional benefits over Prometheus datasource, this dashboard is based on VictoriaMetrics datasource. Please follow these instructions to enable datasource in Grafana.
Please find the detailed description and example instructions of how to use this dashboard in our guide for default preset of vmanomaly.
Description
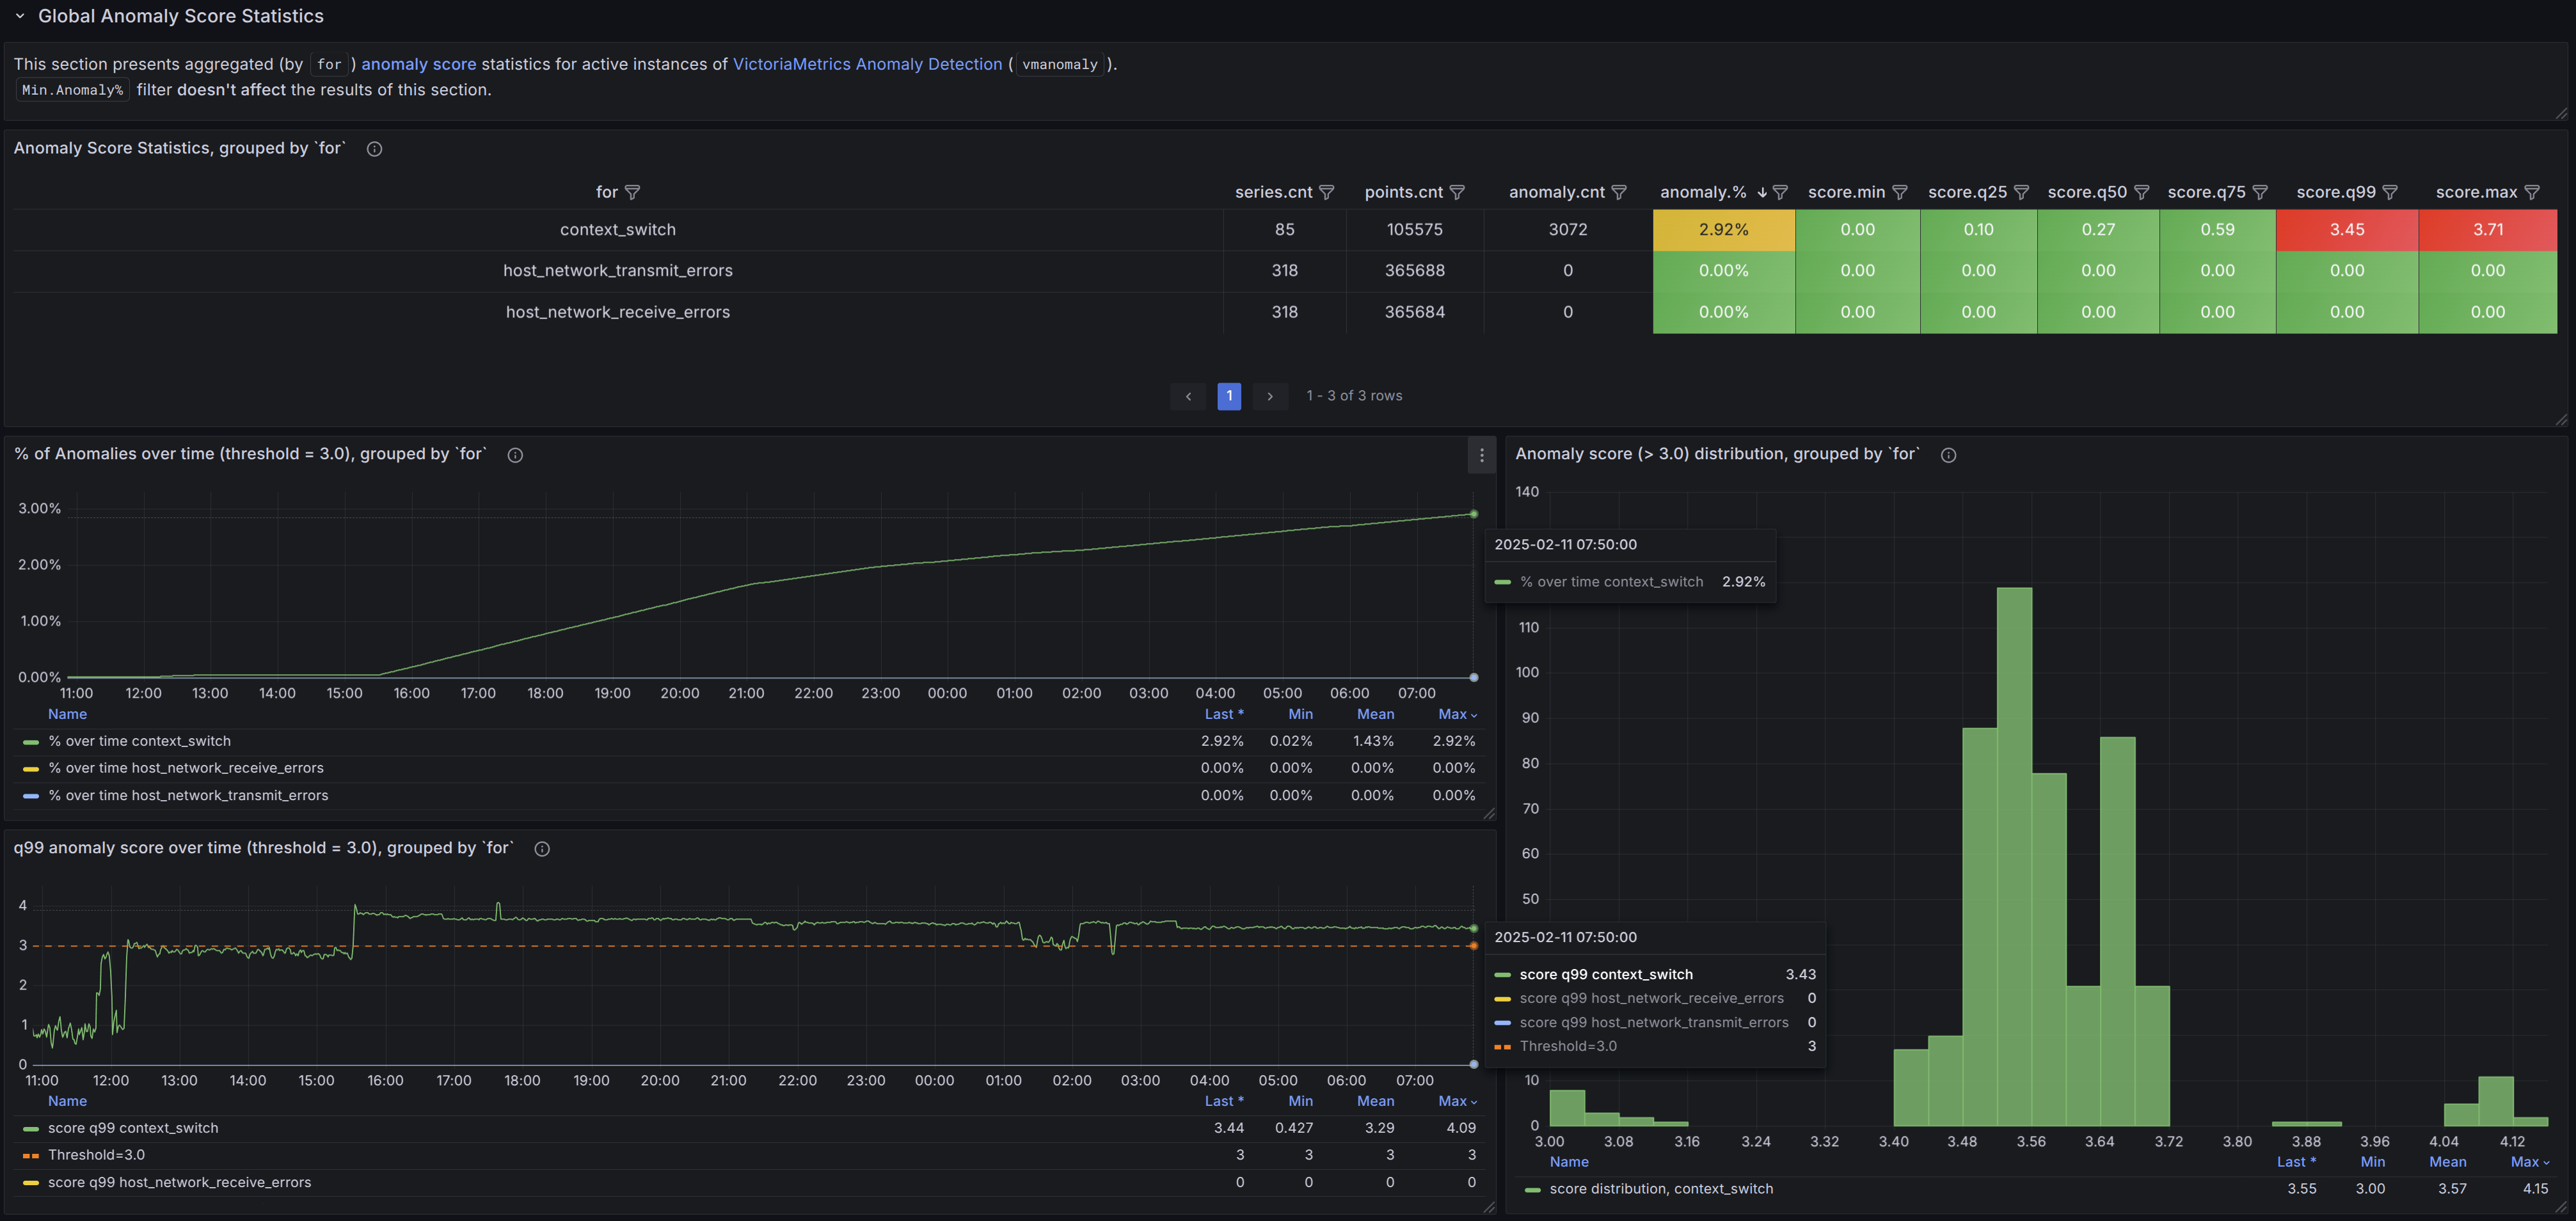
This dashboard provides a comprehensive view of anomaly scores over time, based on vmanomaly output, specifically anomaly_score metrics.
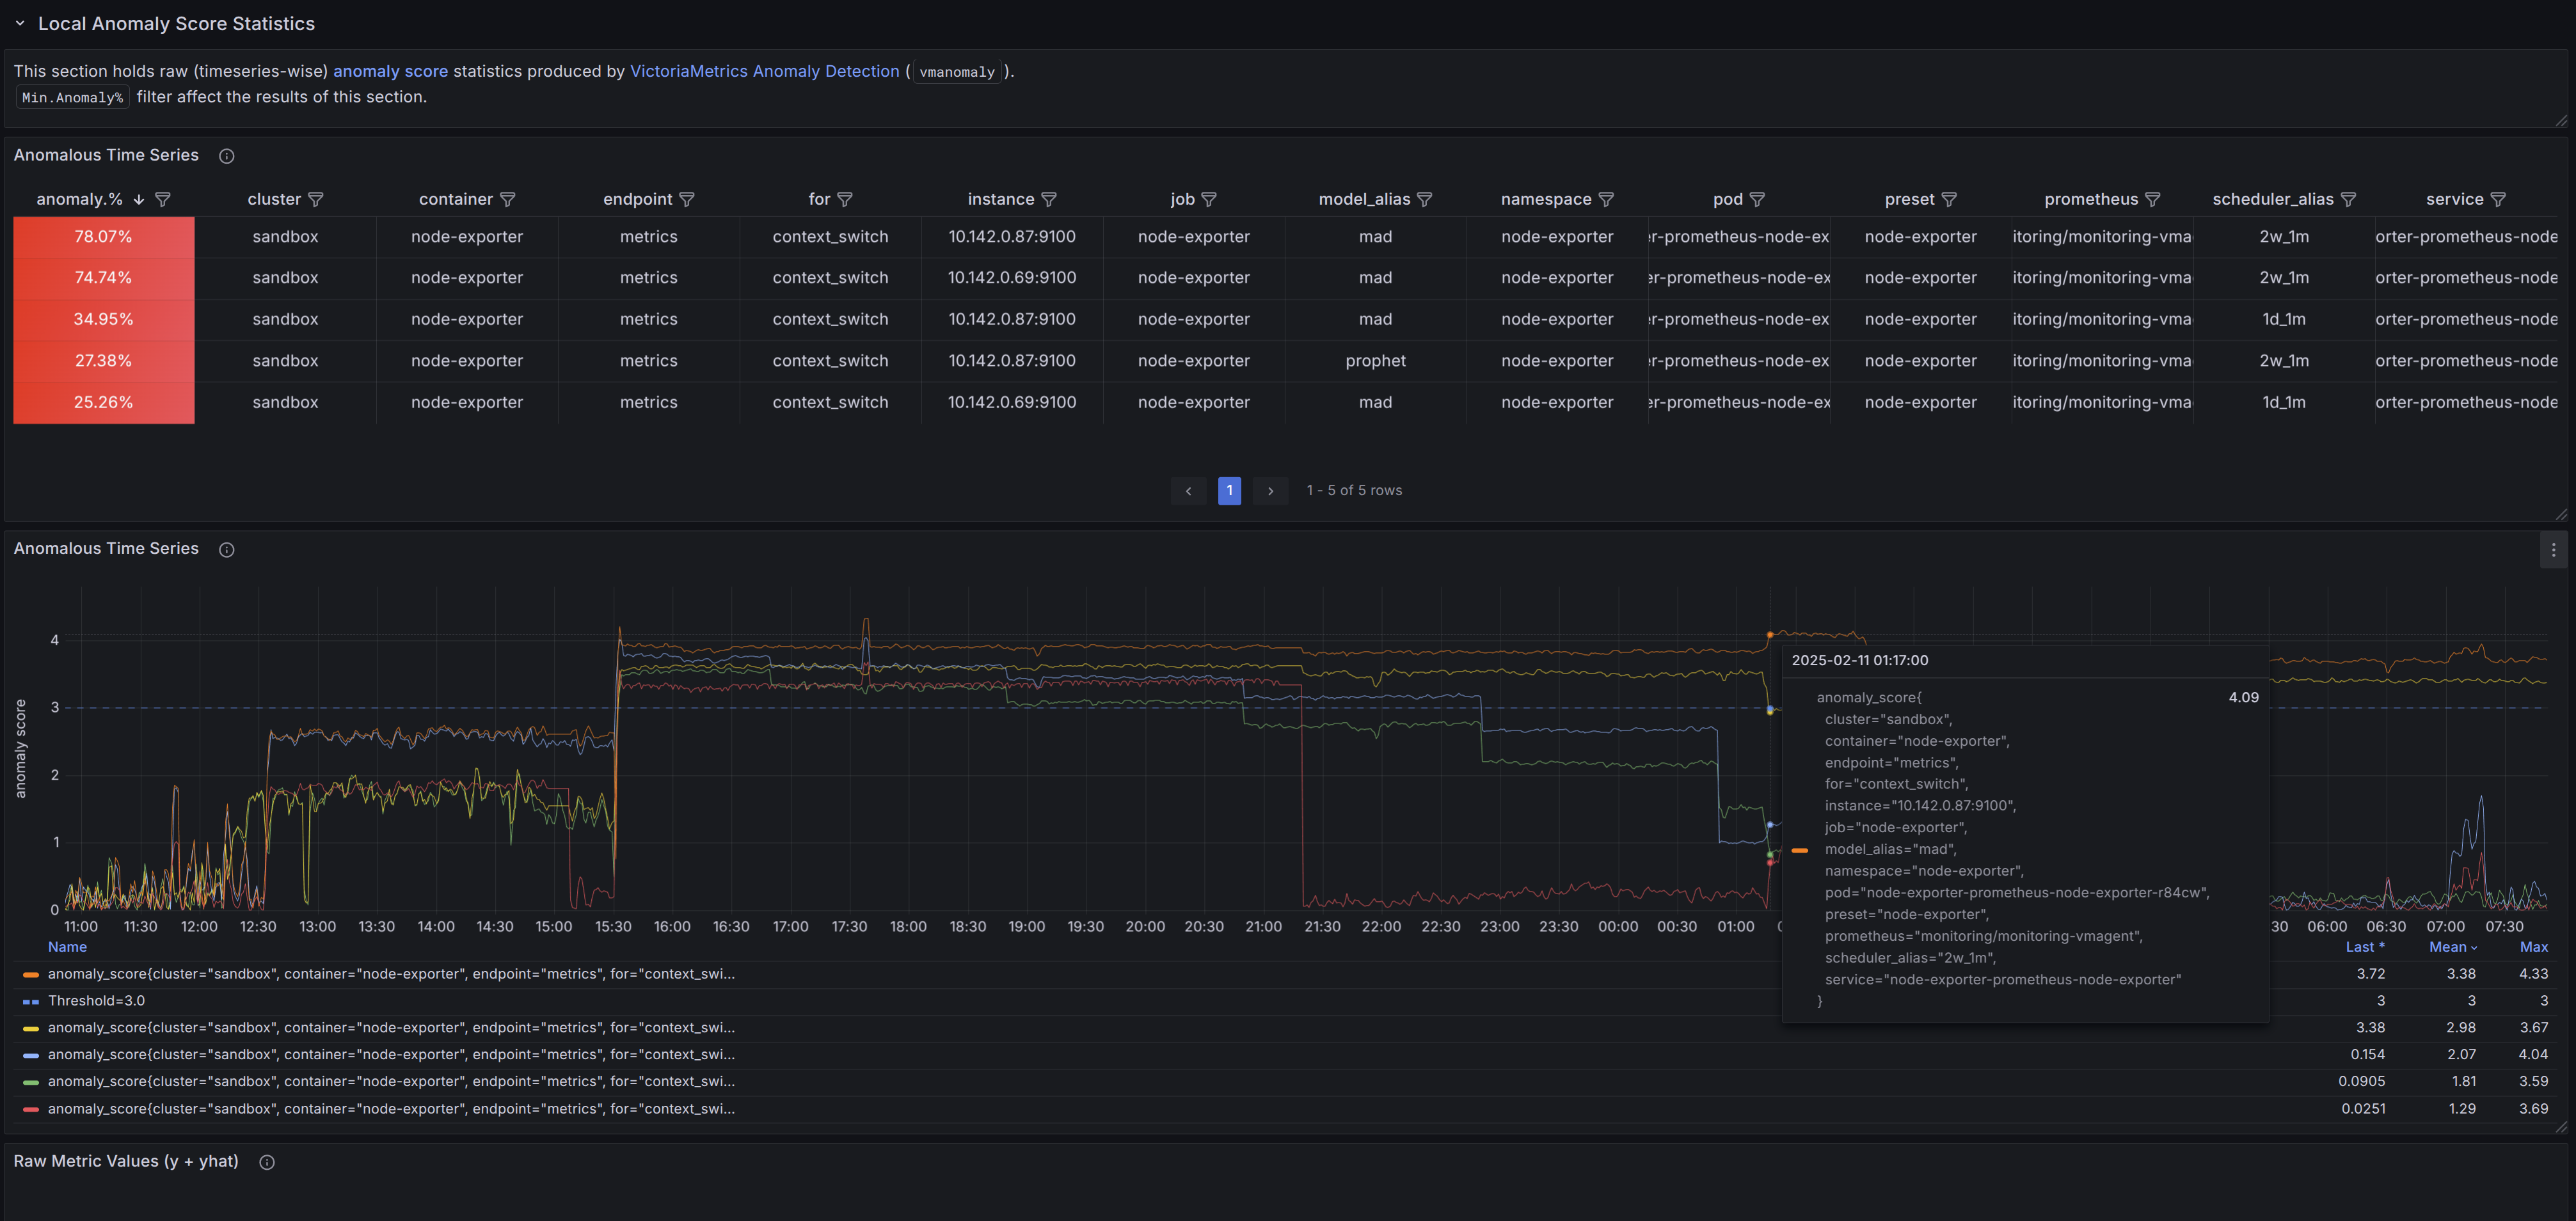
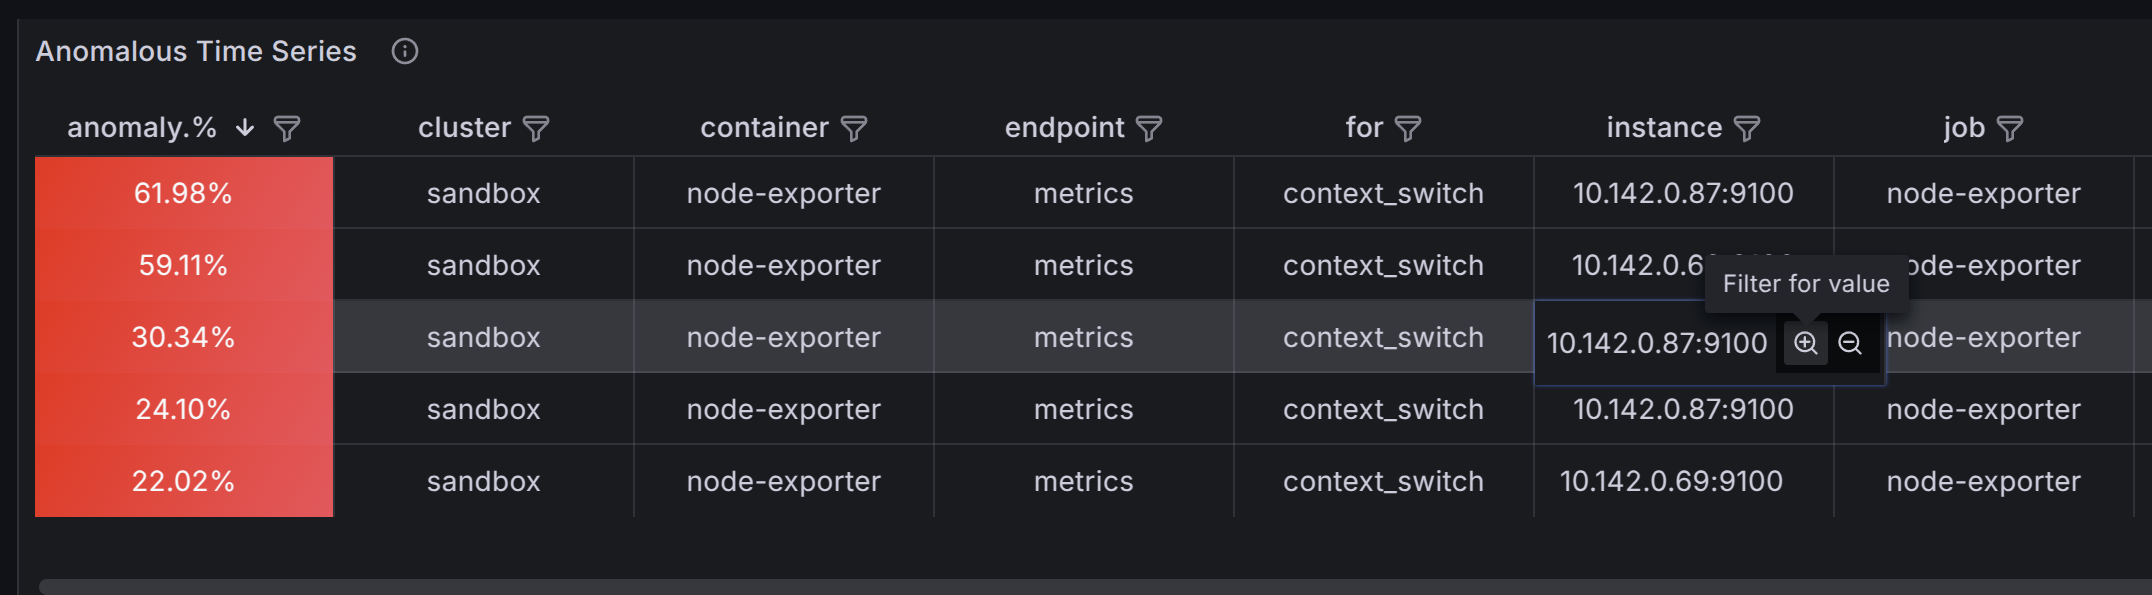
It offers both a global view (aggregated statistics across selected grouping labels) and a detailed drill-down into individual anomaly scores and raw metric values. Users can apply filters, explore patterns, and refine anomaly detection configurations interactively.
For best practices on navigation and vmanomaly configuration tuning, refer to the guide section and follow the provided dashboard hints.
If you have suggestions, improvements, or bug reports, feel free to open an issue or leave a review on the dashboard.
More information about vmanomaly.
Check out the latest release notes and Docker images. Helm charts are available here.
Data source config
Collector config:
Upload an updated version of an exported dashboard.json file from Grafana
| Revision | Description | Created | |
|---|---|---|---|
| Download |