
Core Hub metrics v2
Core Hub /metrics (Prometheus). Pipeline name is the Control Plane nickname and filters entity panels (rows, stall, latency, throughput). Pipeline id filters checkpoint/lag and connection panels — pick both for the pipeline under test, or leave both All. Entity defaults to All. QA visual / mid-bright wow build (version 5).
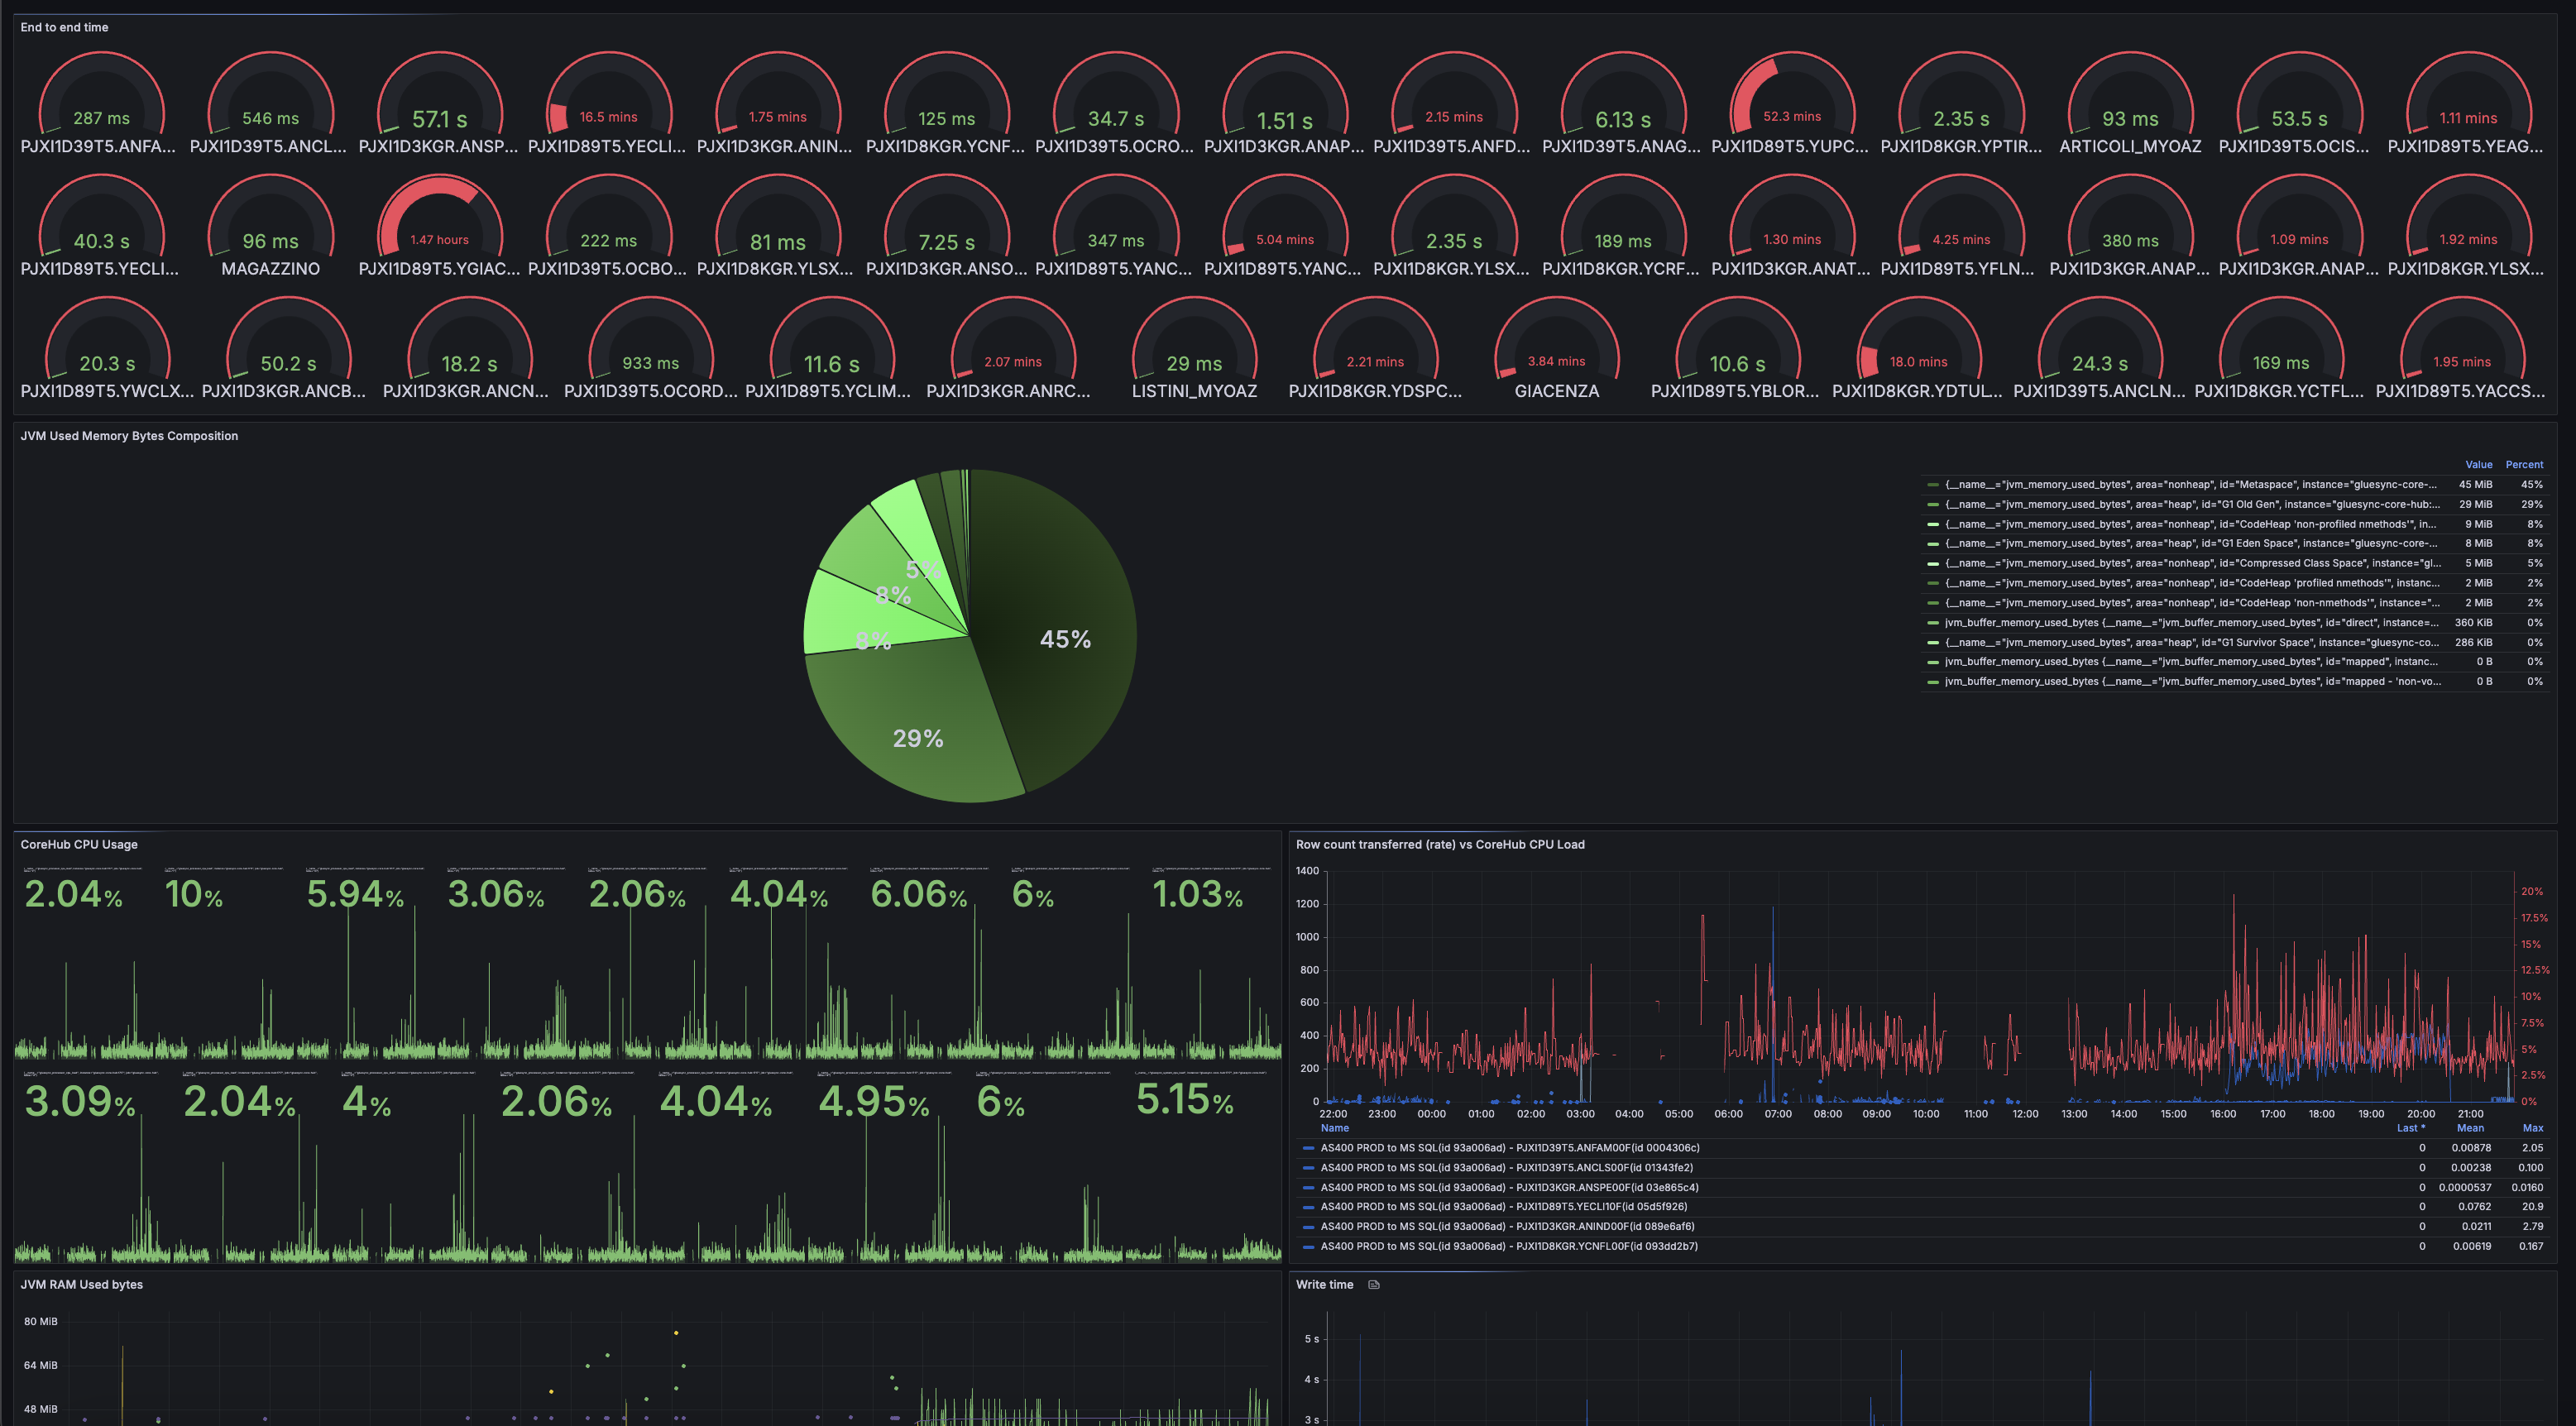
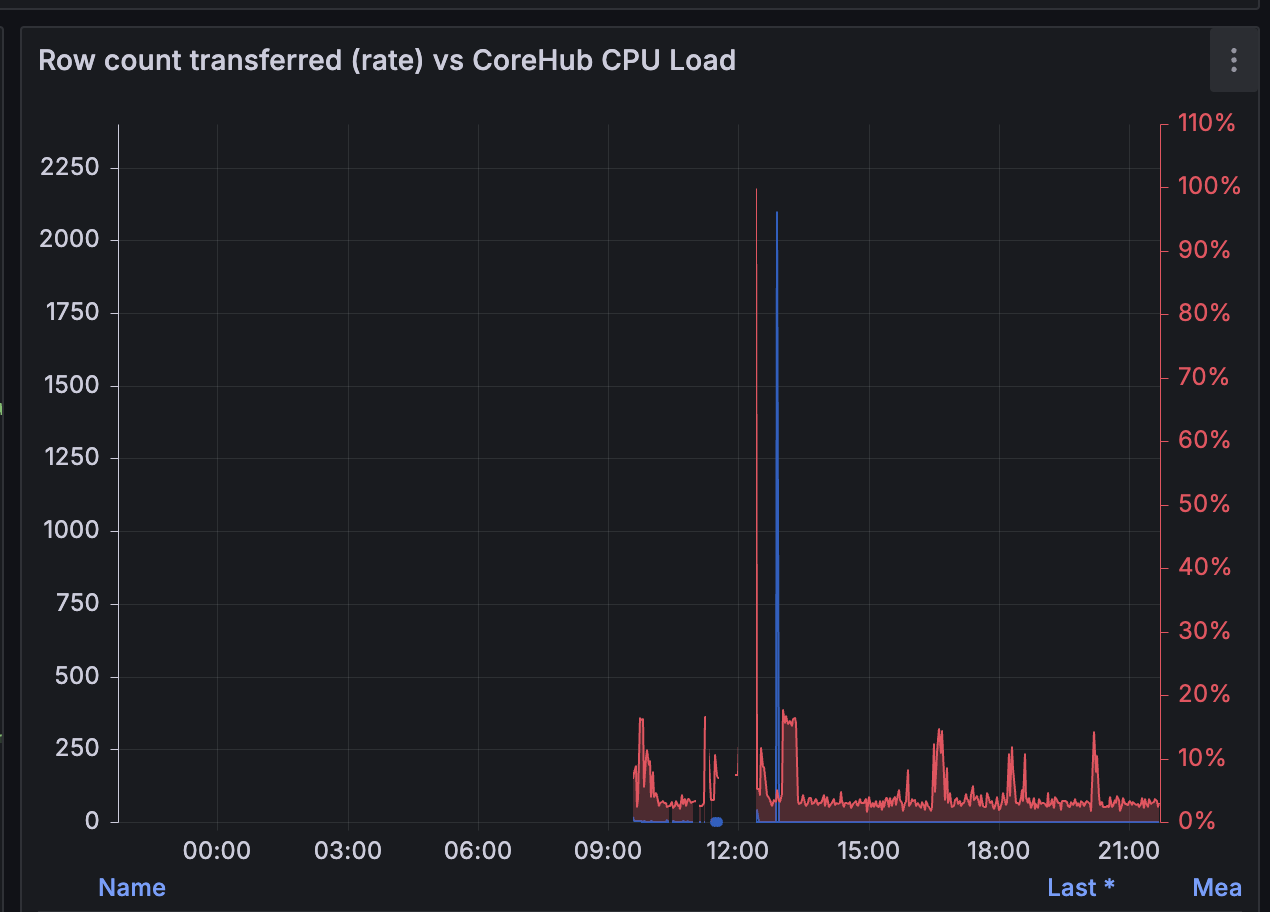
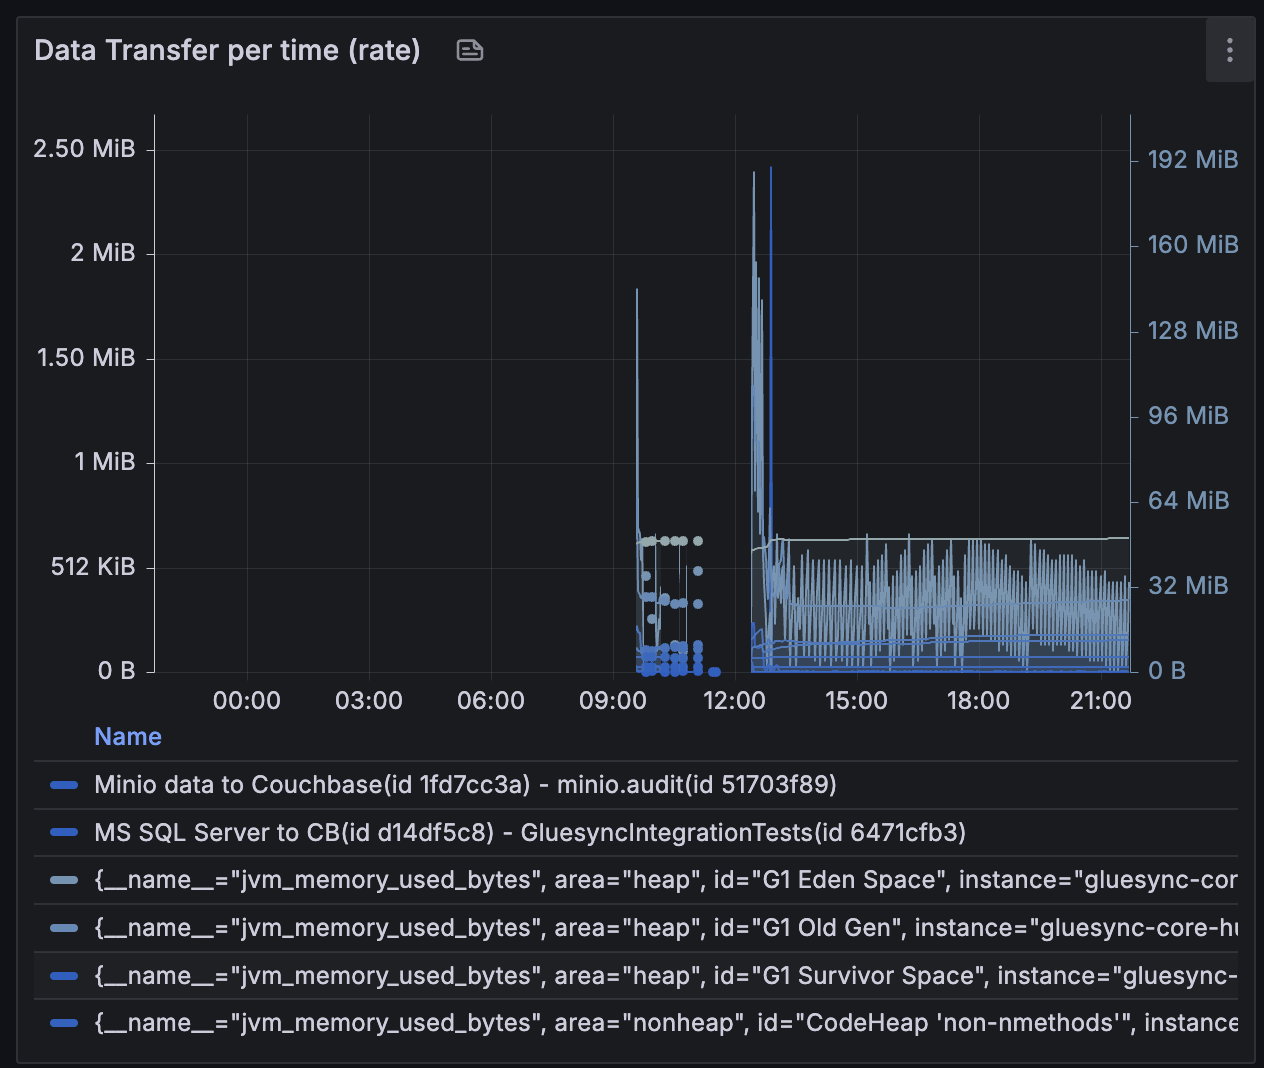
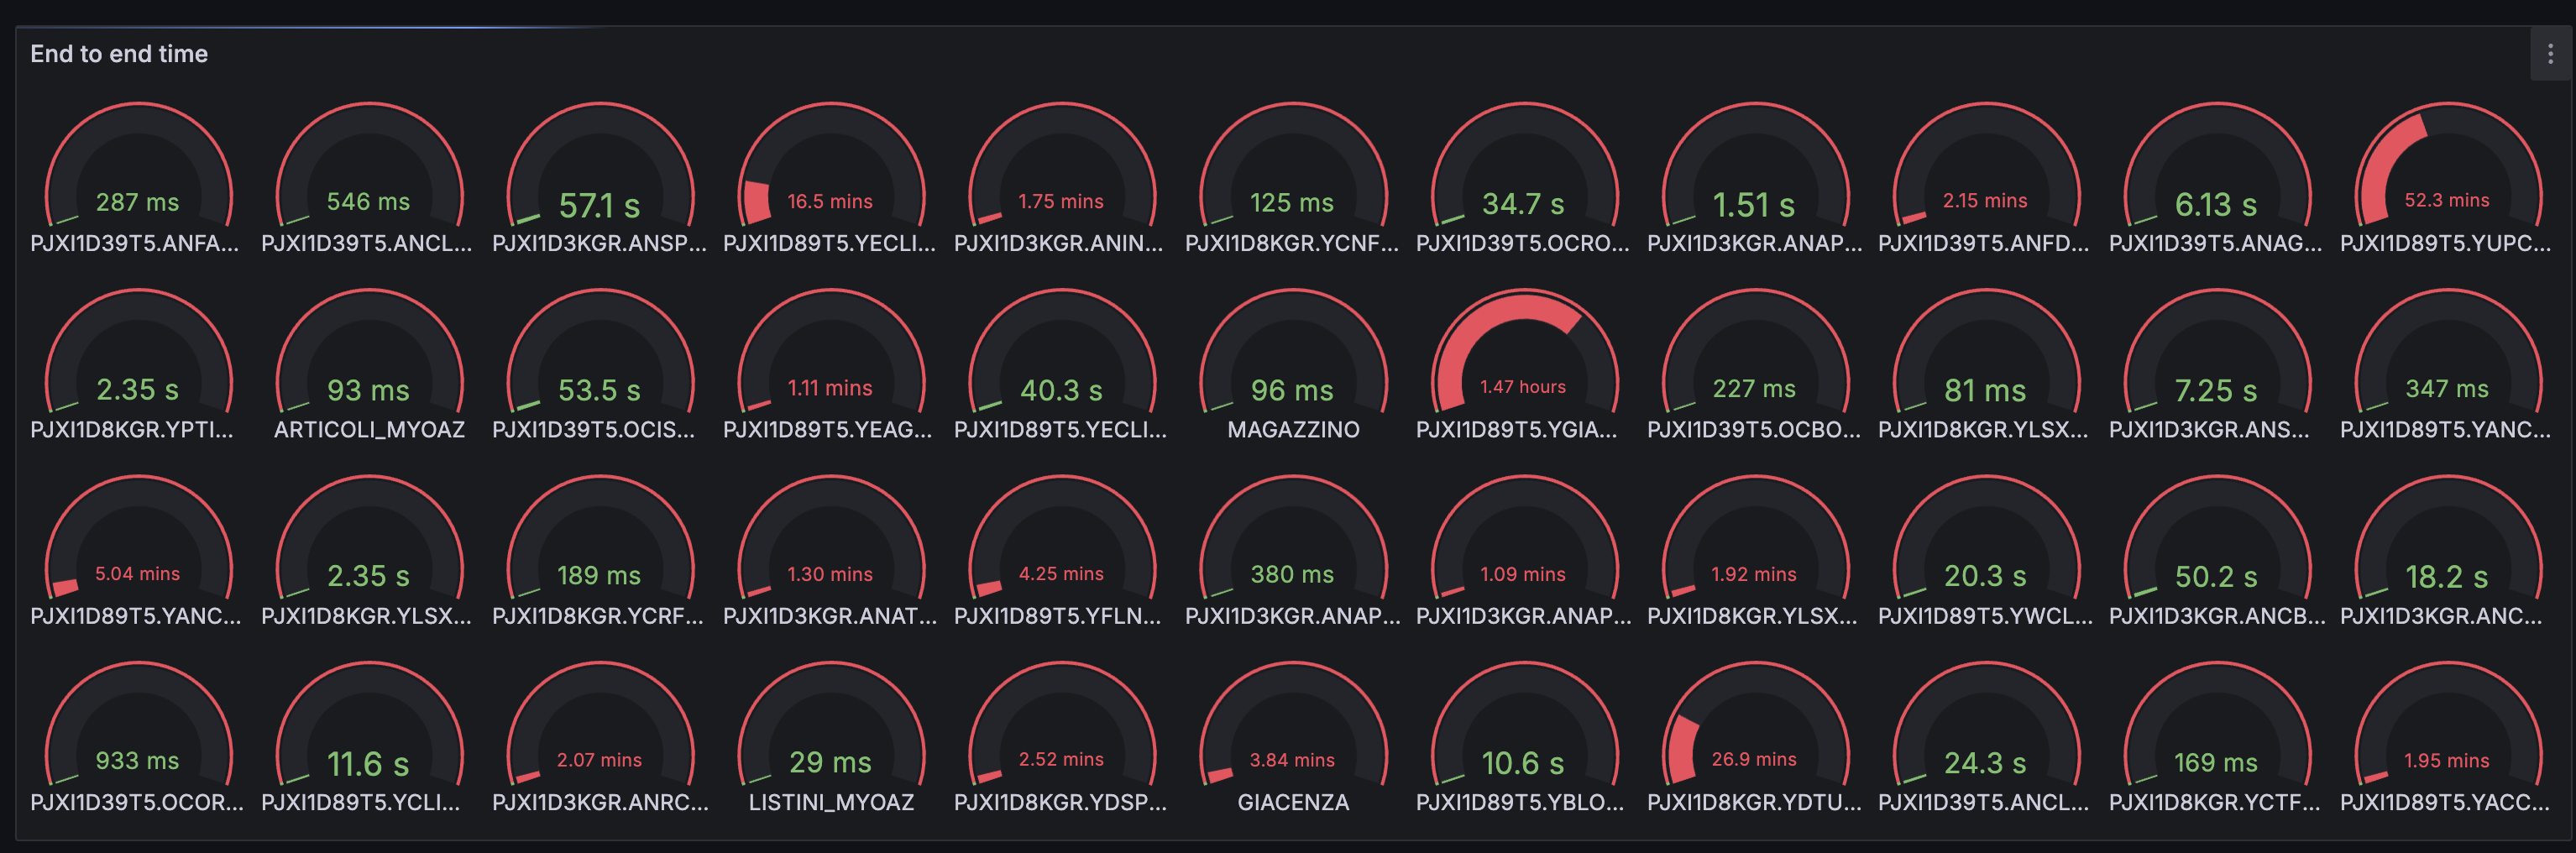
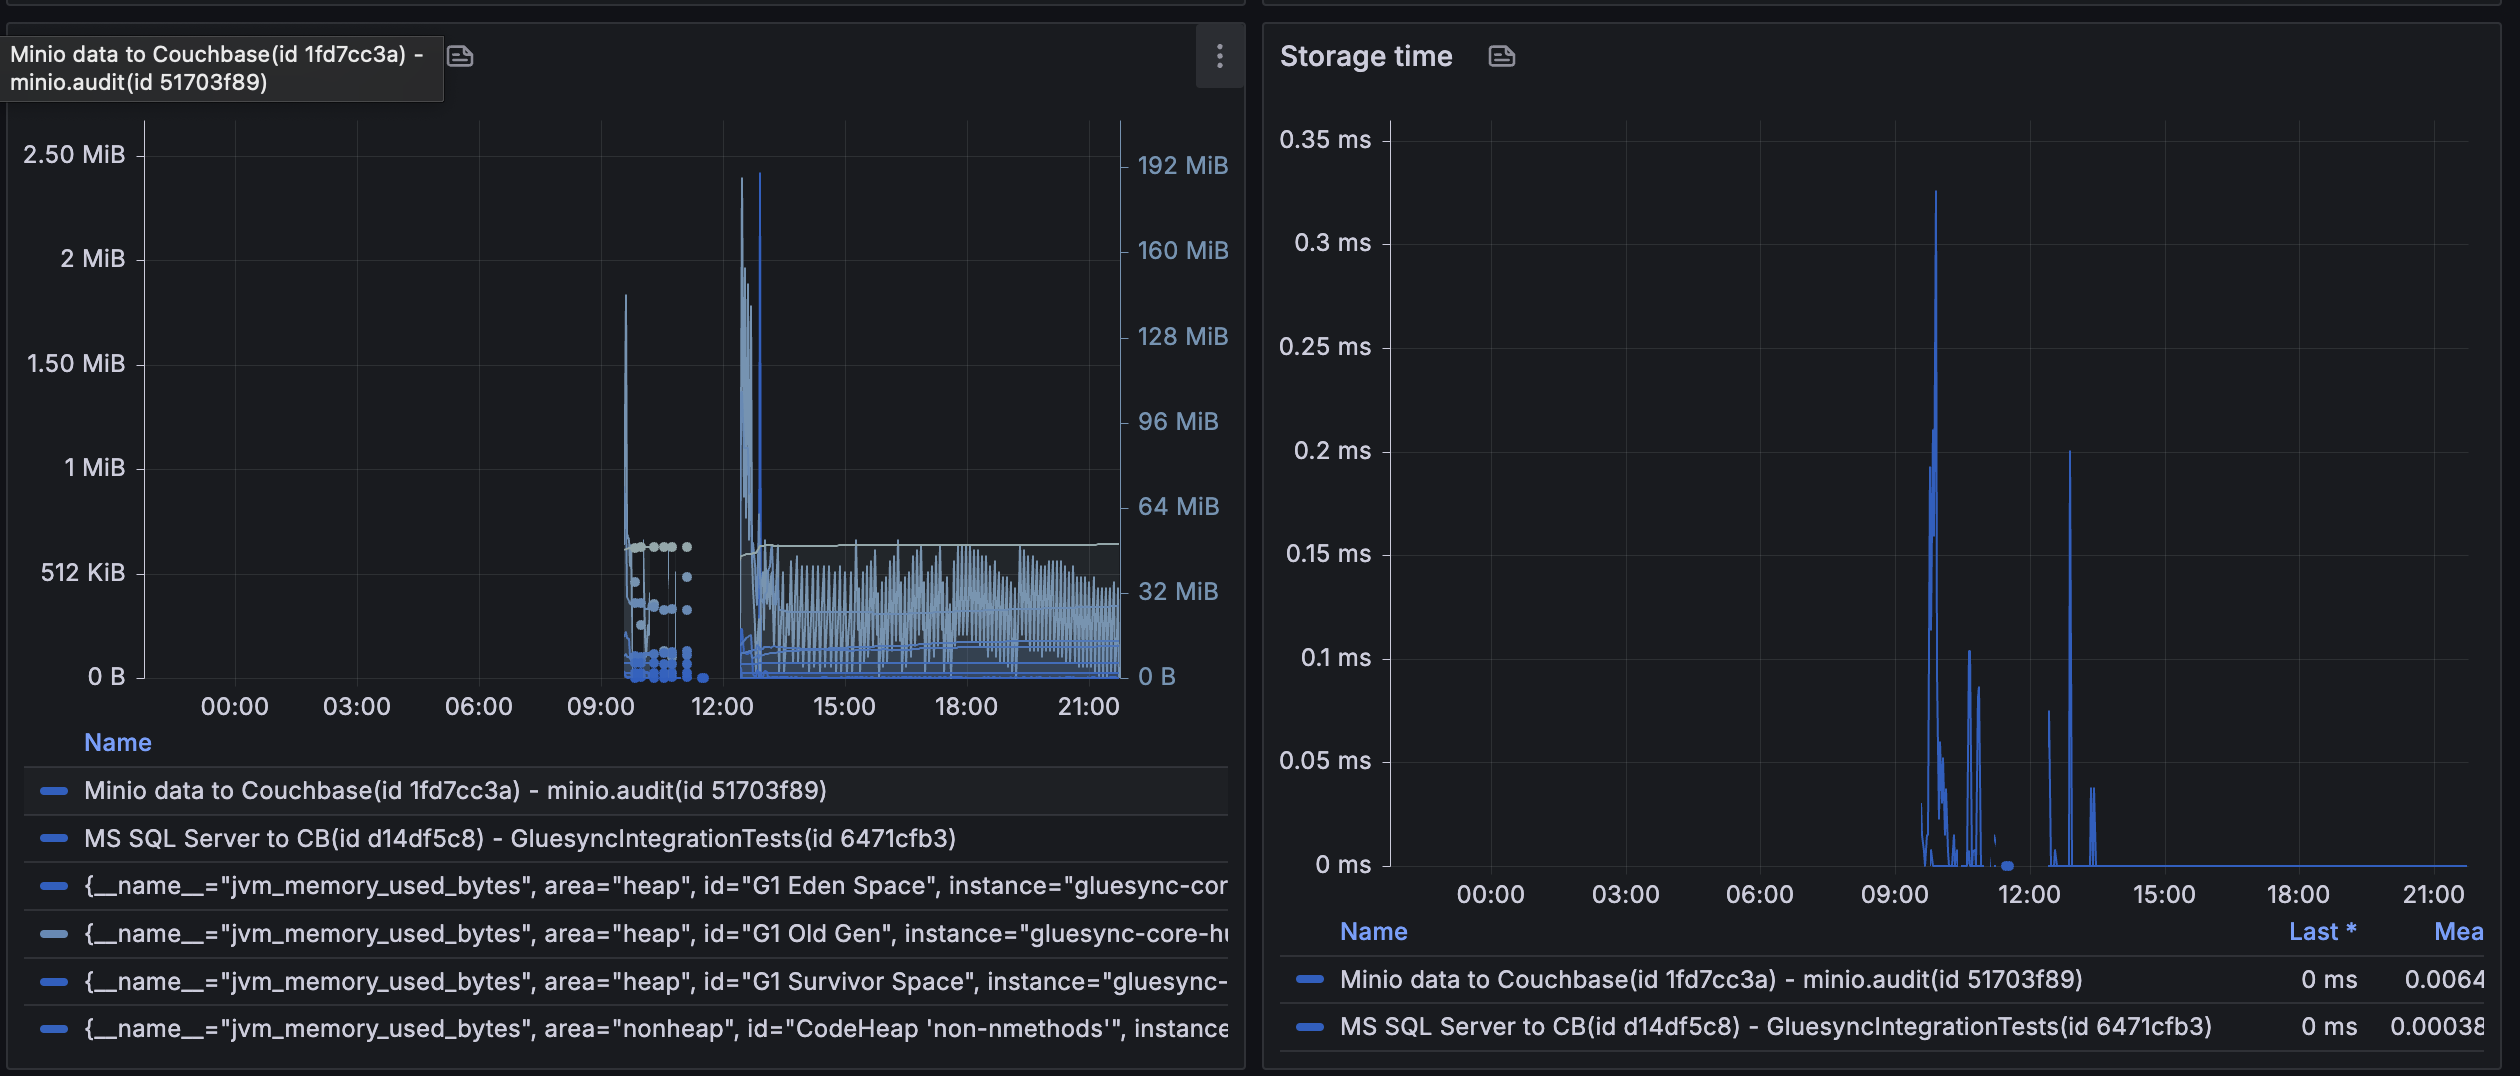
Gluesync’s built-in Grafana dashboard comprehensively monitors your data pipelines through multiple visualization panels. All metrics are collected via Prometheus and visualized in real time:
Performance metrics Read/Write Time Graphs: Detailed millisecond-level latency tracking for read and write operations.
End-to-end Time: Visual representation of complete pipeline processing duration
Storage Time: Monitoring of data storage operations and their timing
Pipeline status indicators Individual Pipeline Metrics: Circular gauges showing processing times for each pipeline
Pipeline Health Indicators: Color-coded status indicators (green for healthy, red for issues)
Latency Tracking: Real-time monitoring of processing delays and bottlenecks
Data transfer monitoring Total Data Transferred: Graph showing cumulative data transfer volume over time
Row Count Tracking: Visual representation of the number of rows processed
Transfer Rate Analysis: Metrics showing data throughput and processing speed
Data source config
Collector config:
Upload an updated version of an exported dashboard.json file from Grafana
| Revision | Description | Created | |
|---|---|---|---|
| Download |