Network traffic monitoring
Network traffic monitoring dashboard for eBPF network traffic exporter: https://github.com/kasd/texporter
The texporter project (https://github.com/kasd/texporter) is an eBPF-based network traffic exporter that captures and exposes network metrics for Prometheus. Given its functionality, a Grafana dashboard for it should provide a comprehensive view of network traffic, including byte transfer rates, per-host traffic breakdowns.
Grafana Dashboard
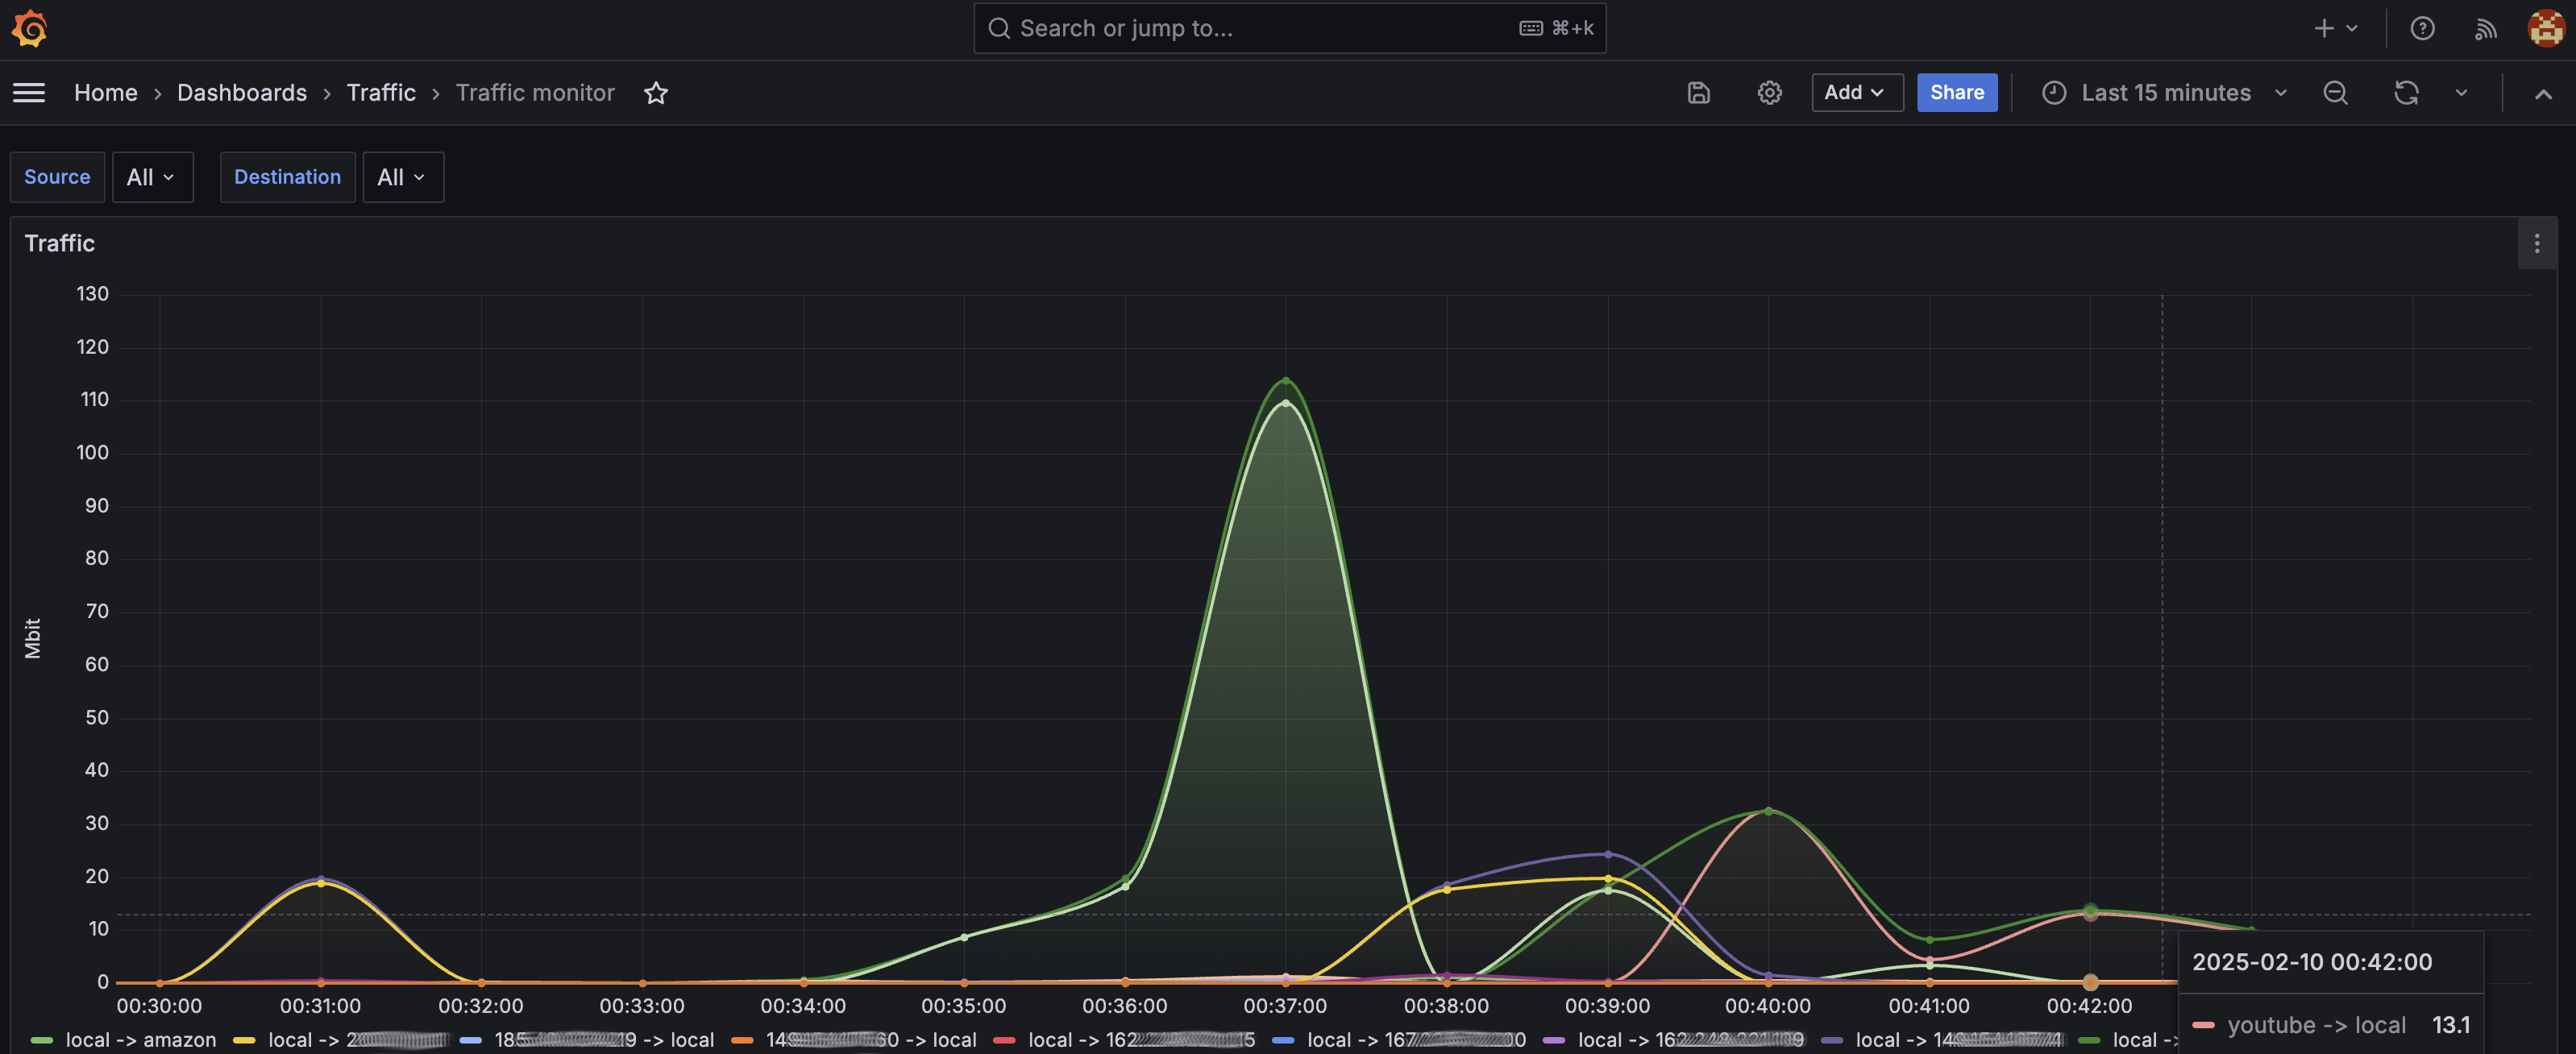
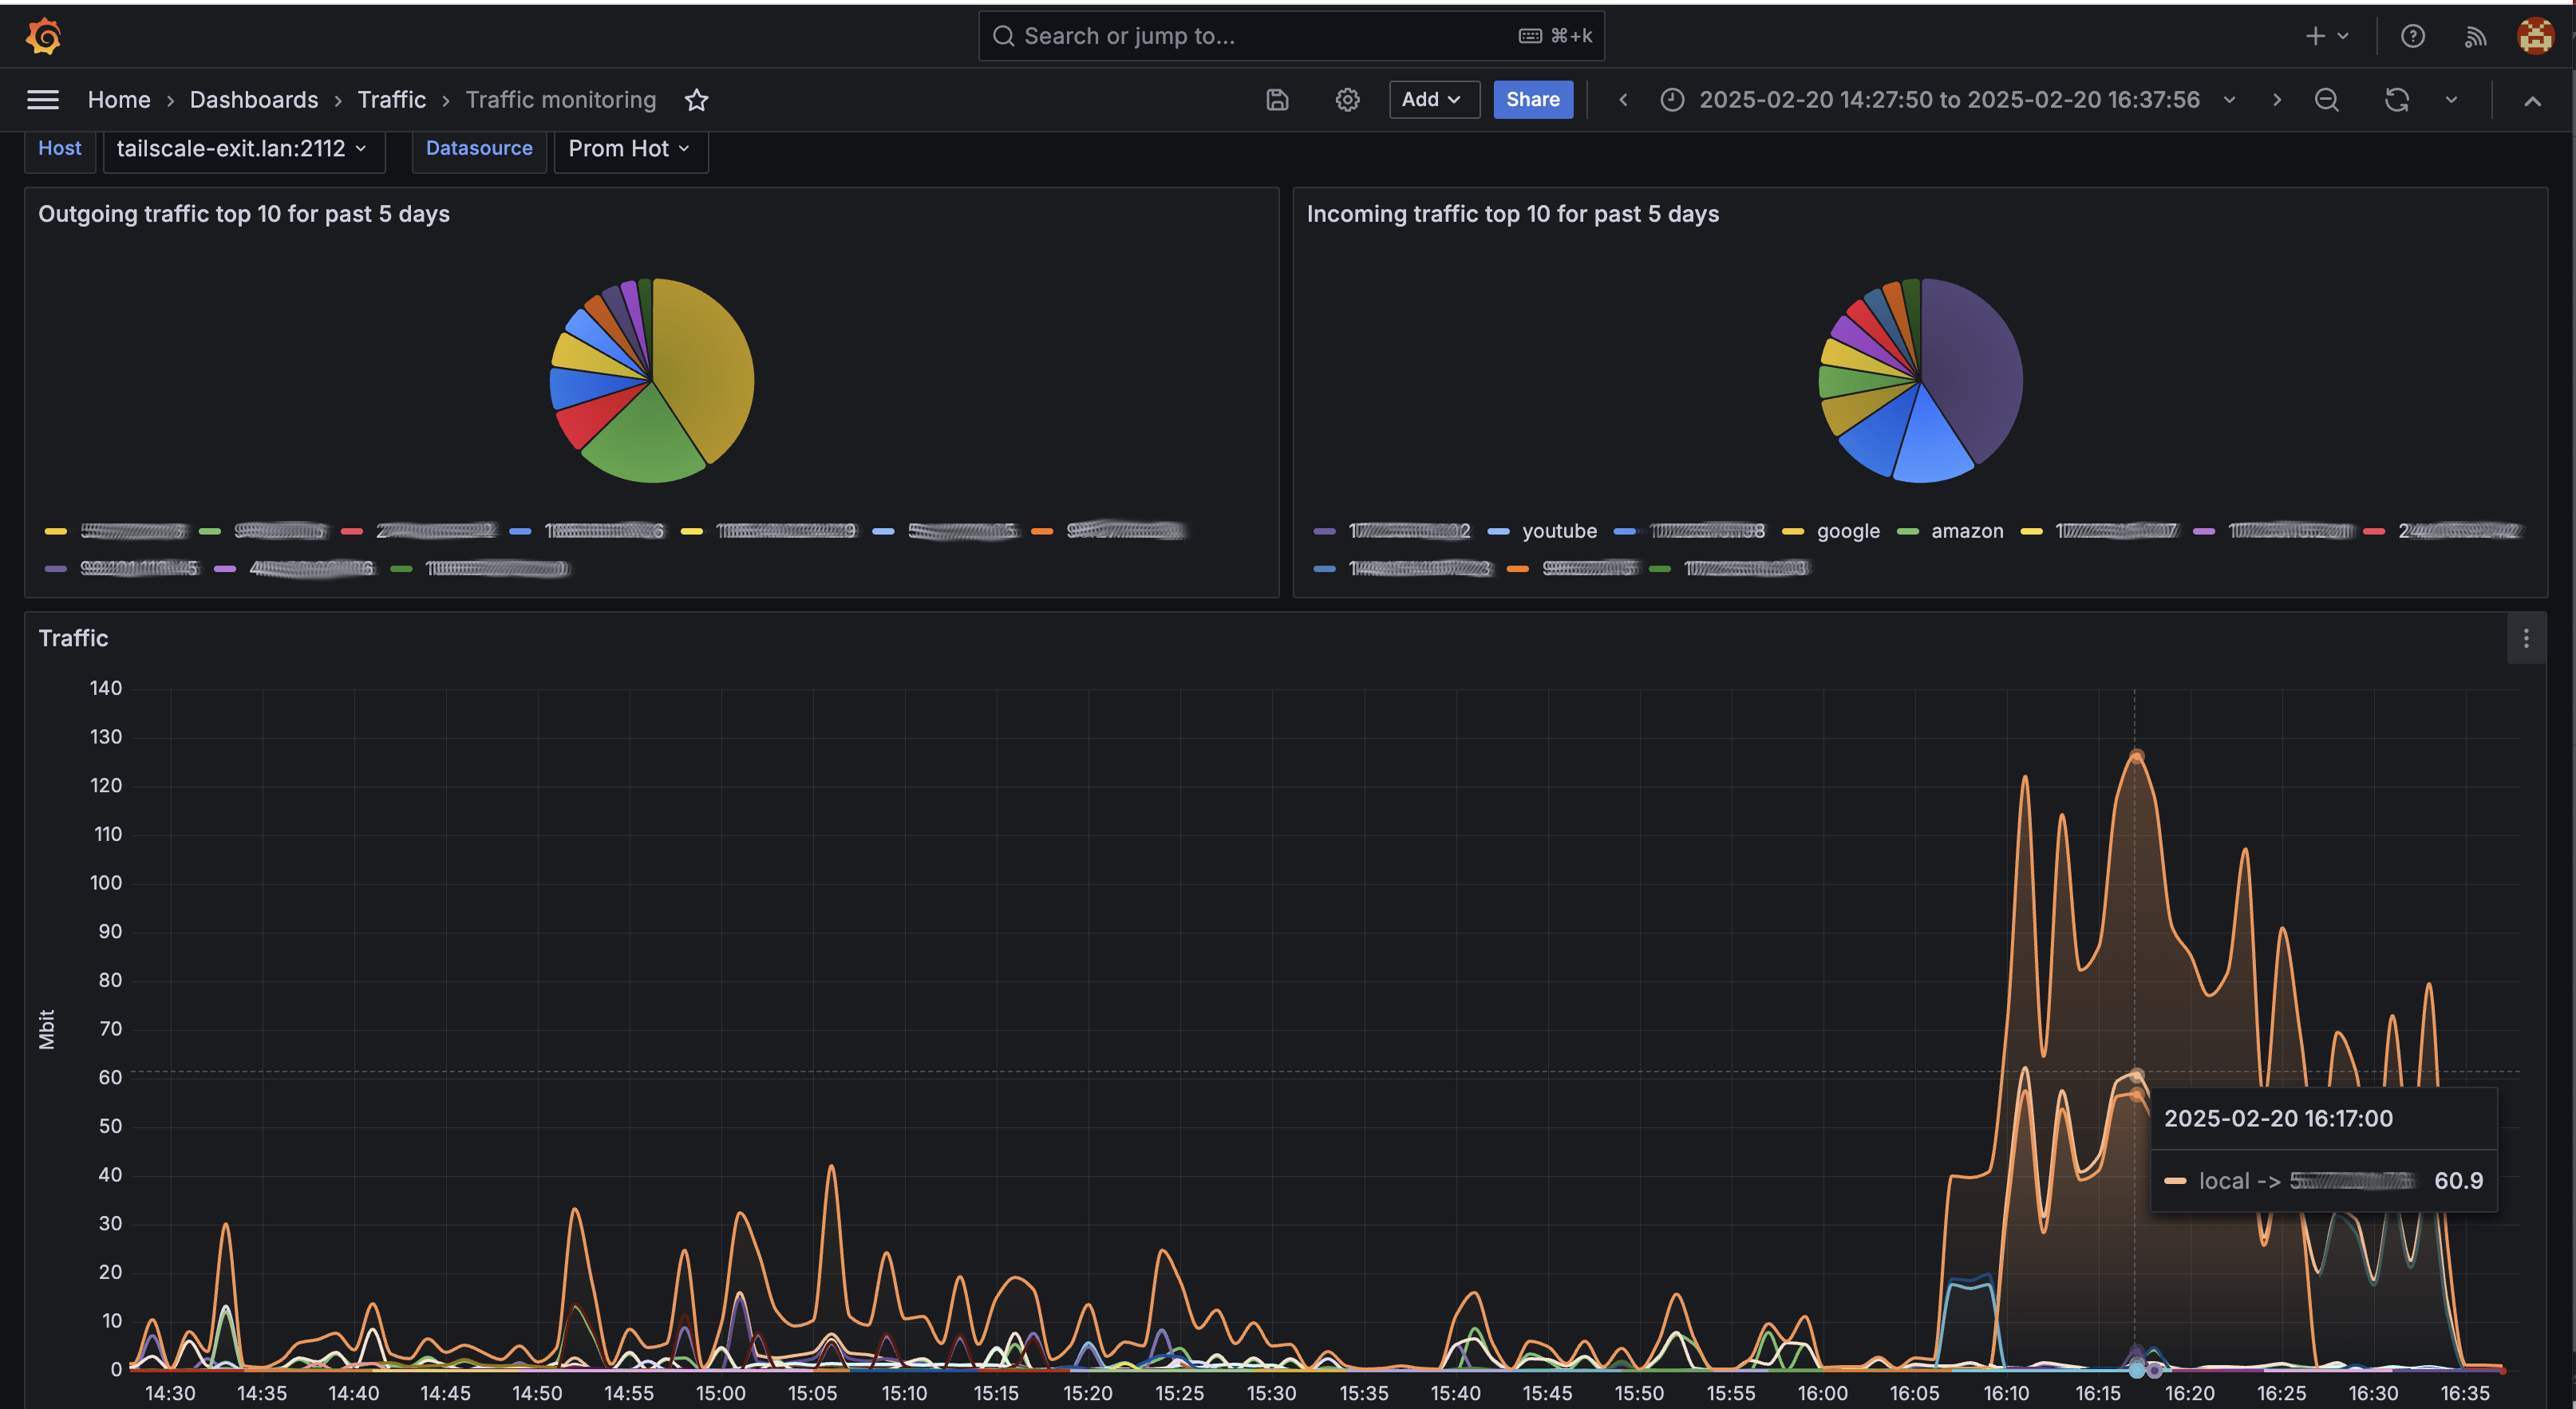
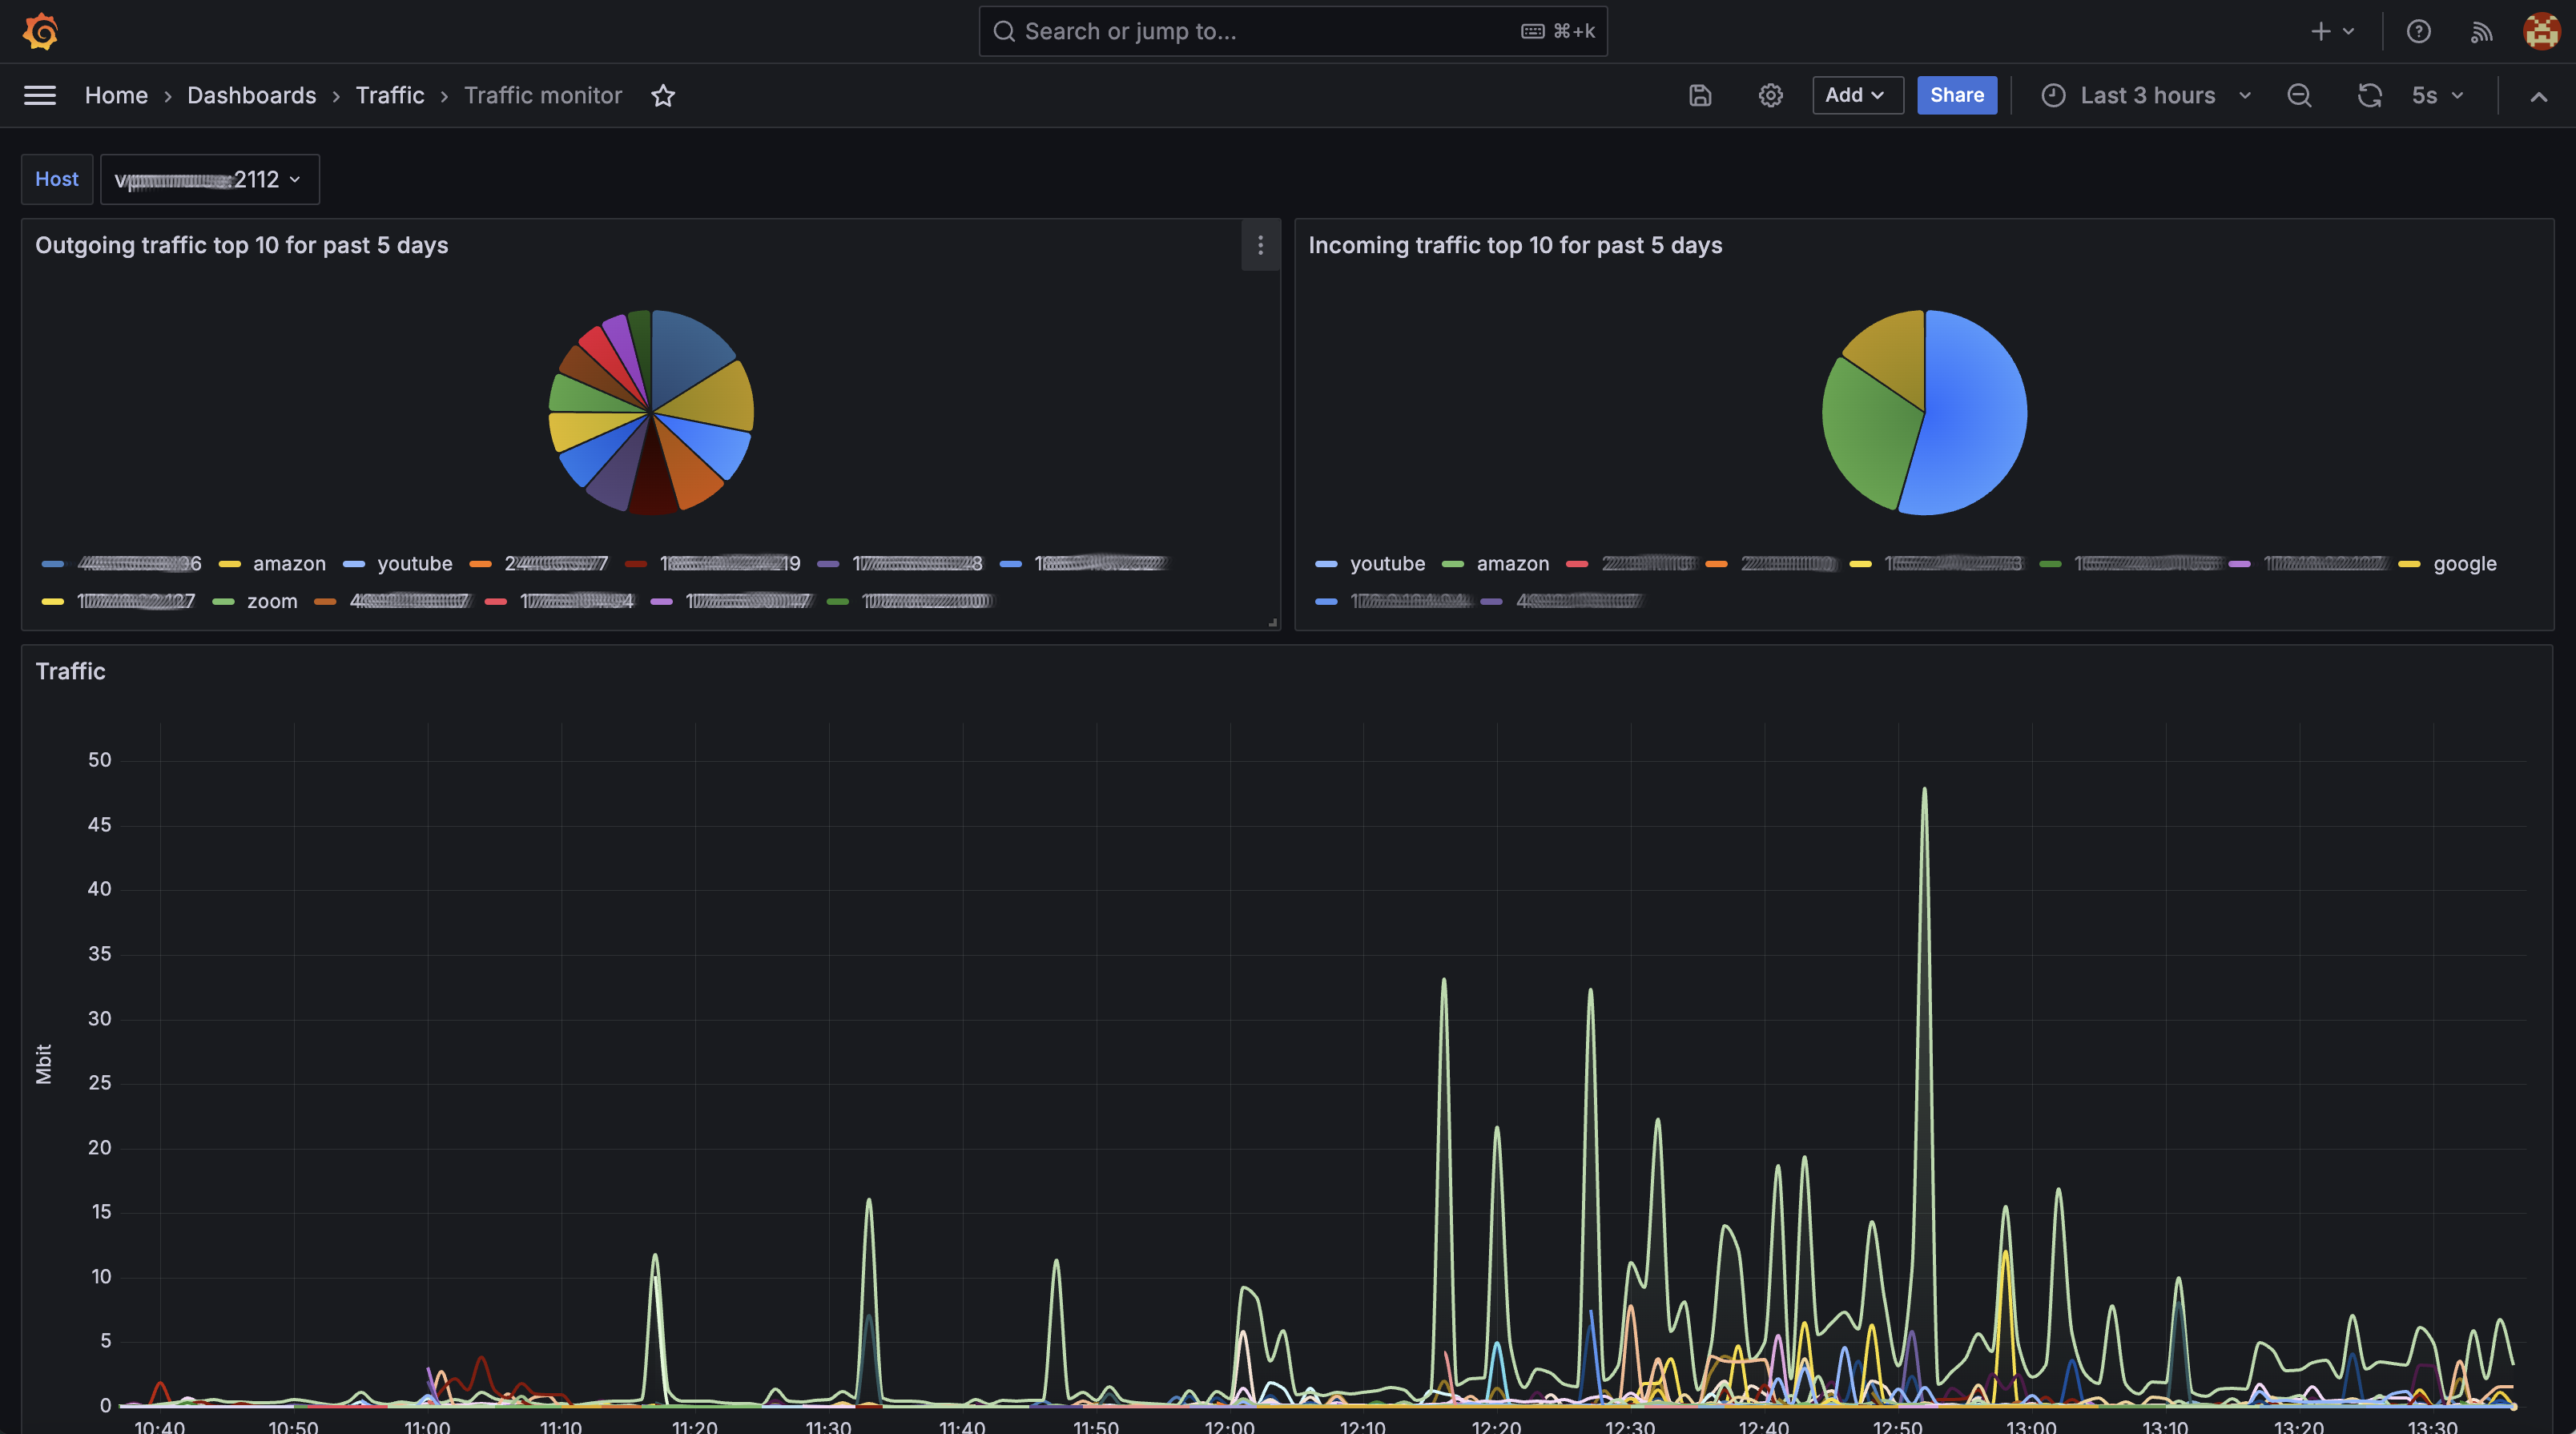
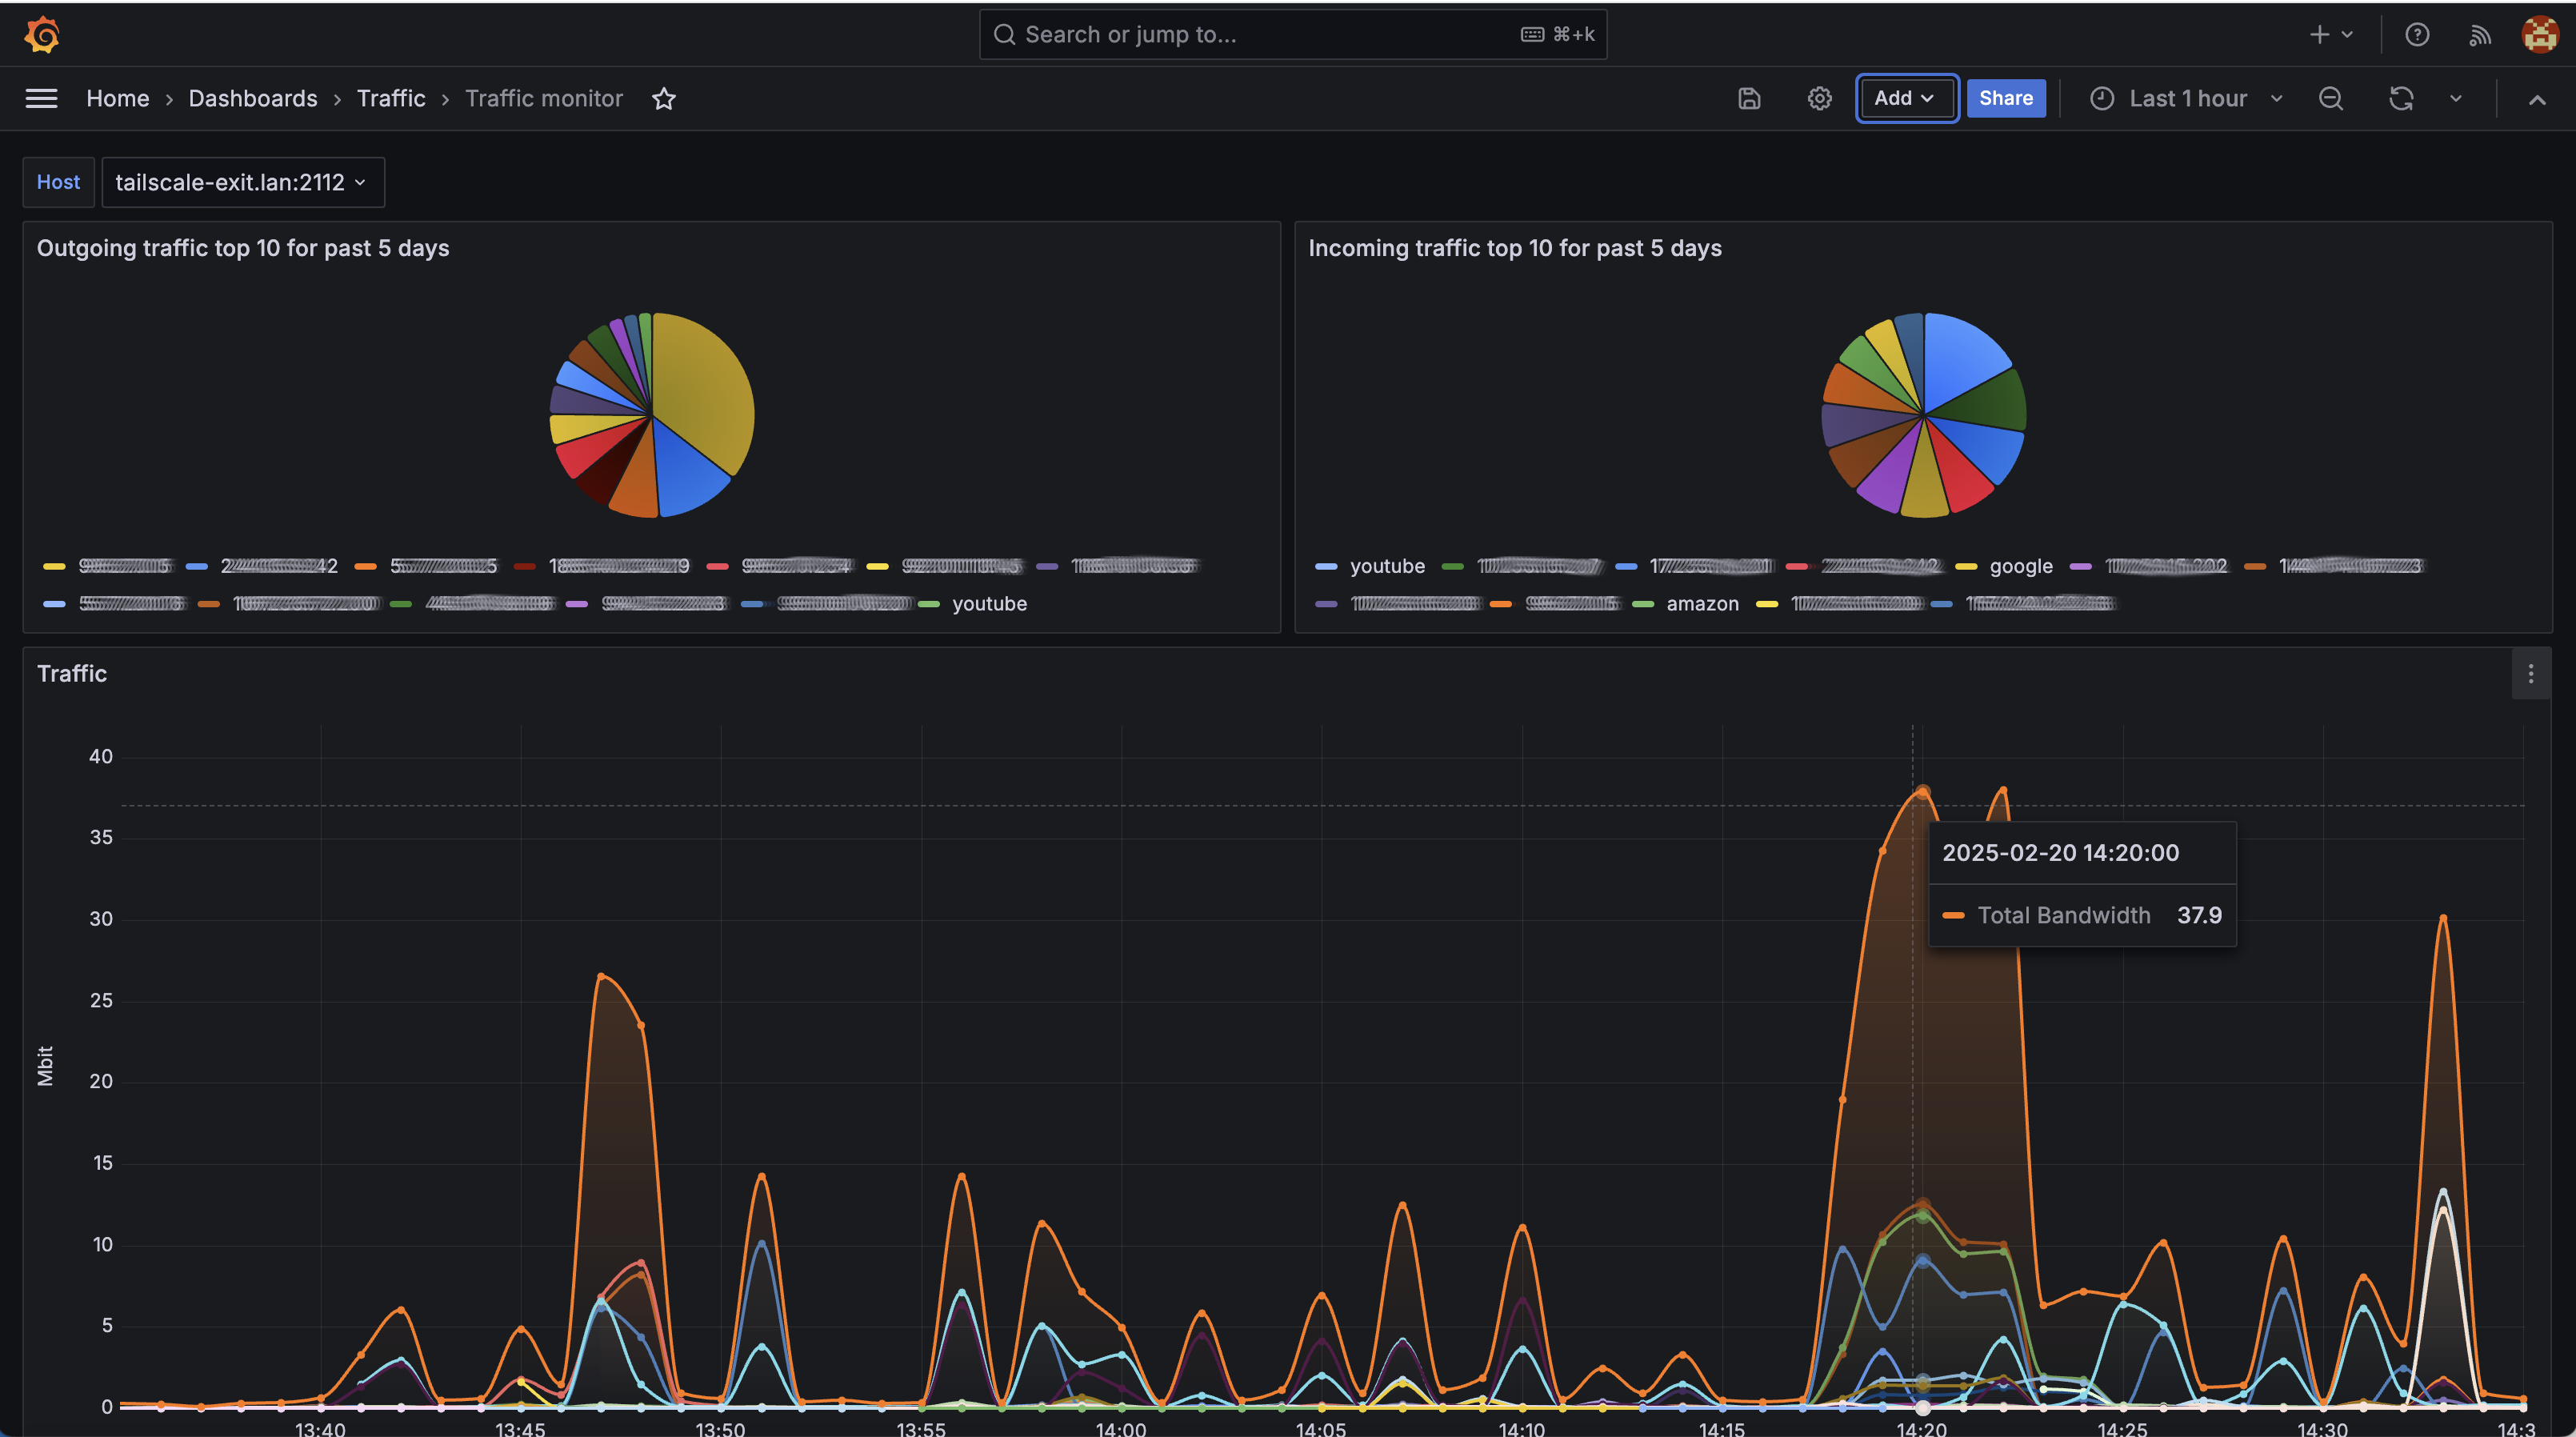
This dashboard visualizes network traffic metrics collected by texporter, helping users analyze network behavior, detect anomalies, and optimize performance. It consists of panels that display traffic statistics by source/destination.
Data source config
Collector type:
Collector plugins:
Collector config:
Revisions
Upload an updated version of an exported dashboard.json file from Grafana
| Revision | Description | Created | |
|---|---|---|---|
| Download |