
Tendermint Monitoring
"Visualize the statistics of Tendermint-based networks using the Tenderduty tool."
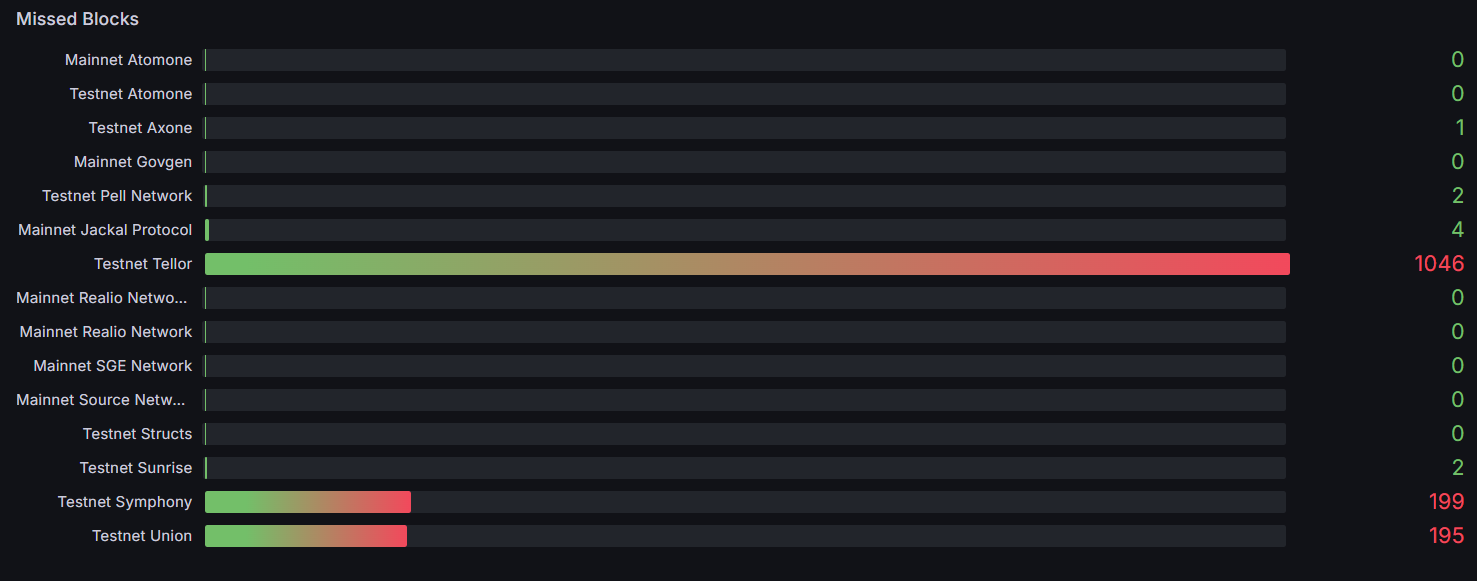
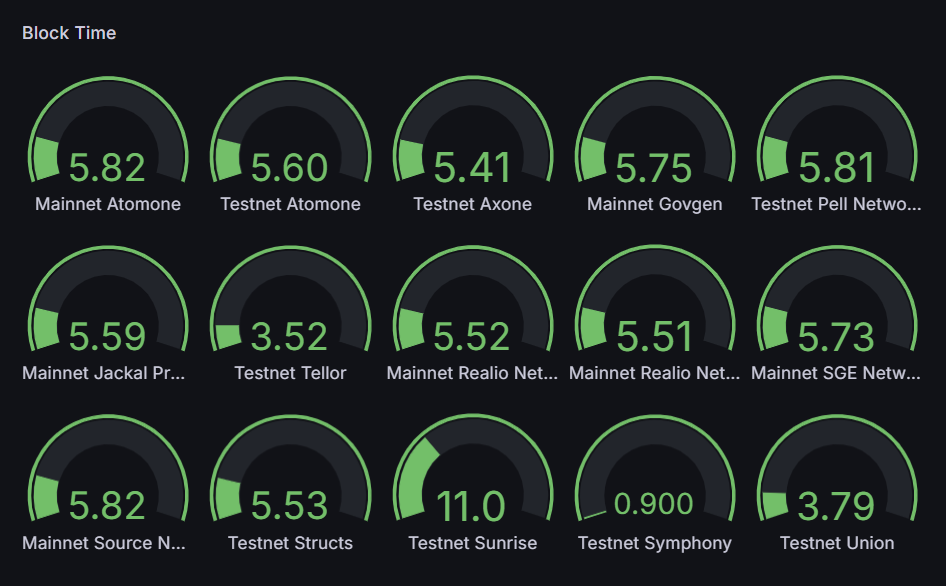
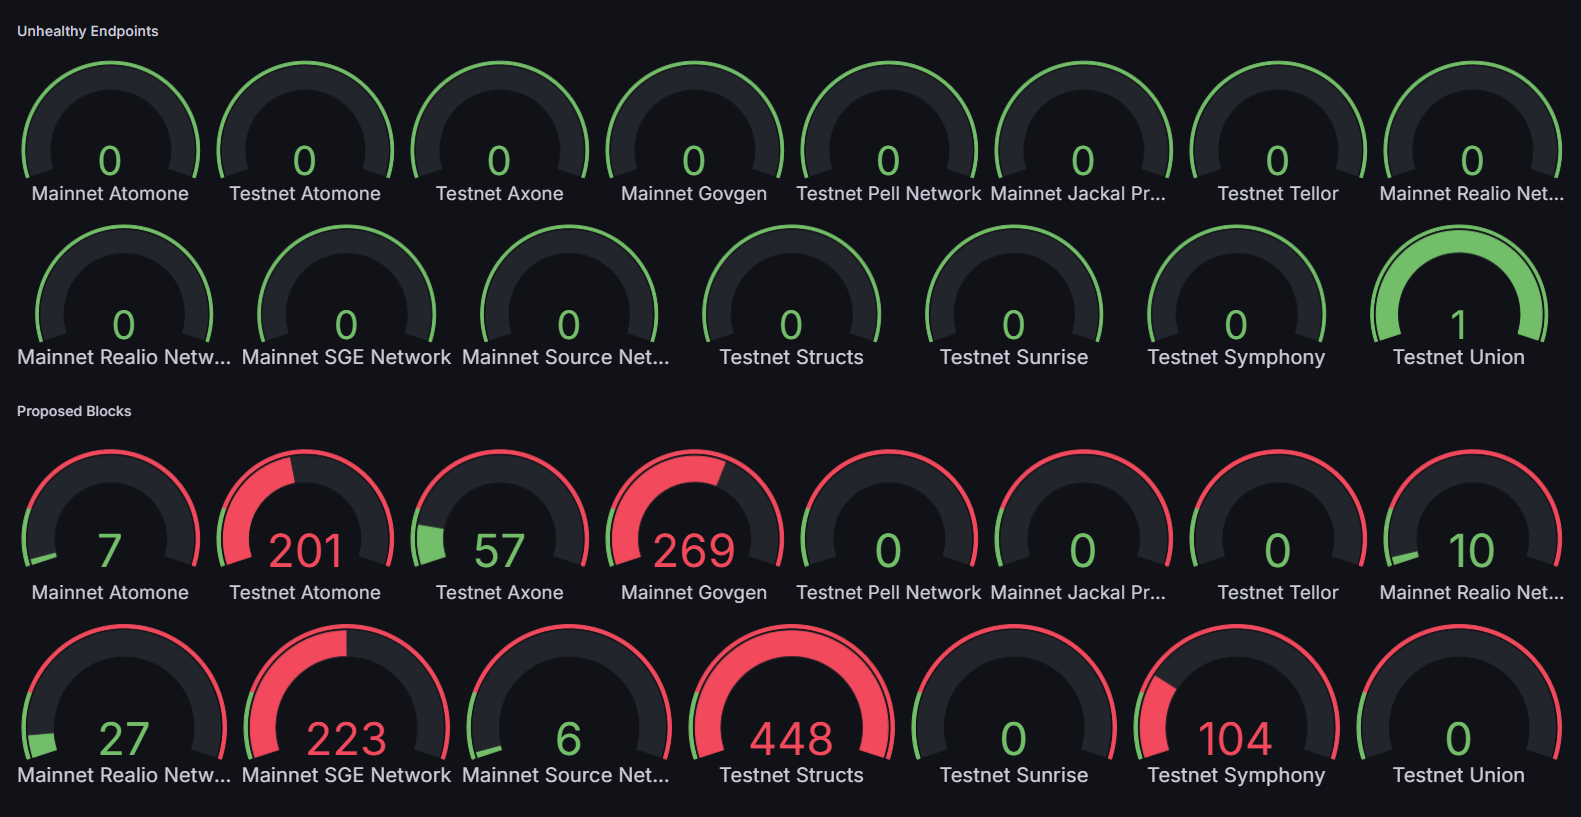

The Tendermint Monitoring dashboard uses the prometheus data source to create a Grafana dashboard with the bargauge, gauge, stat and text panels.
Data source config
Collector type:
Collector plugins:
Collector config:
Revisions
Upload an updated version of an exported dashboard.json file from Grafana
| Revision | Description | Created | |
|---|---|---|---|
| Download |