Caddy
Caddy HTTP server monitoring.
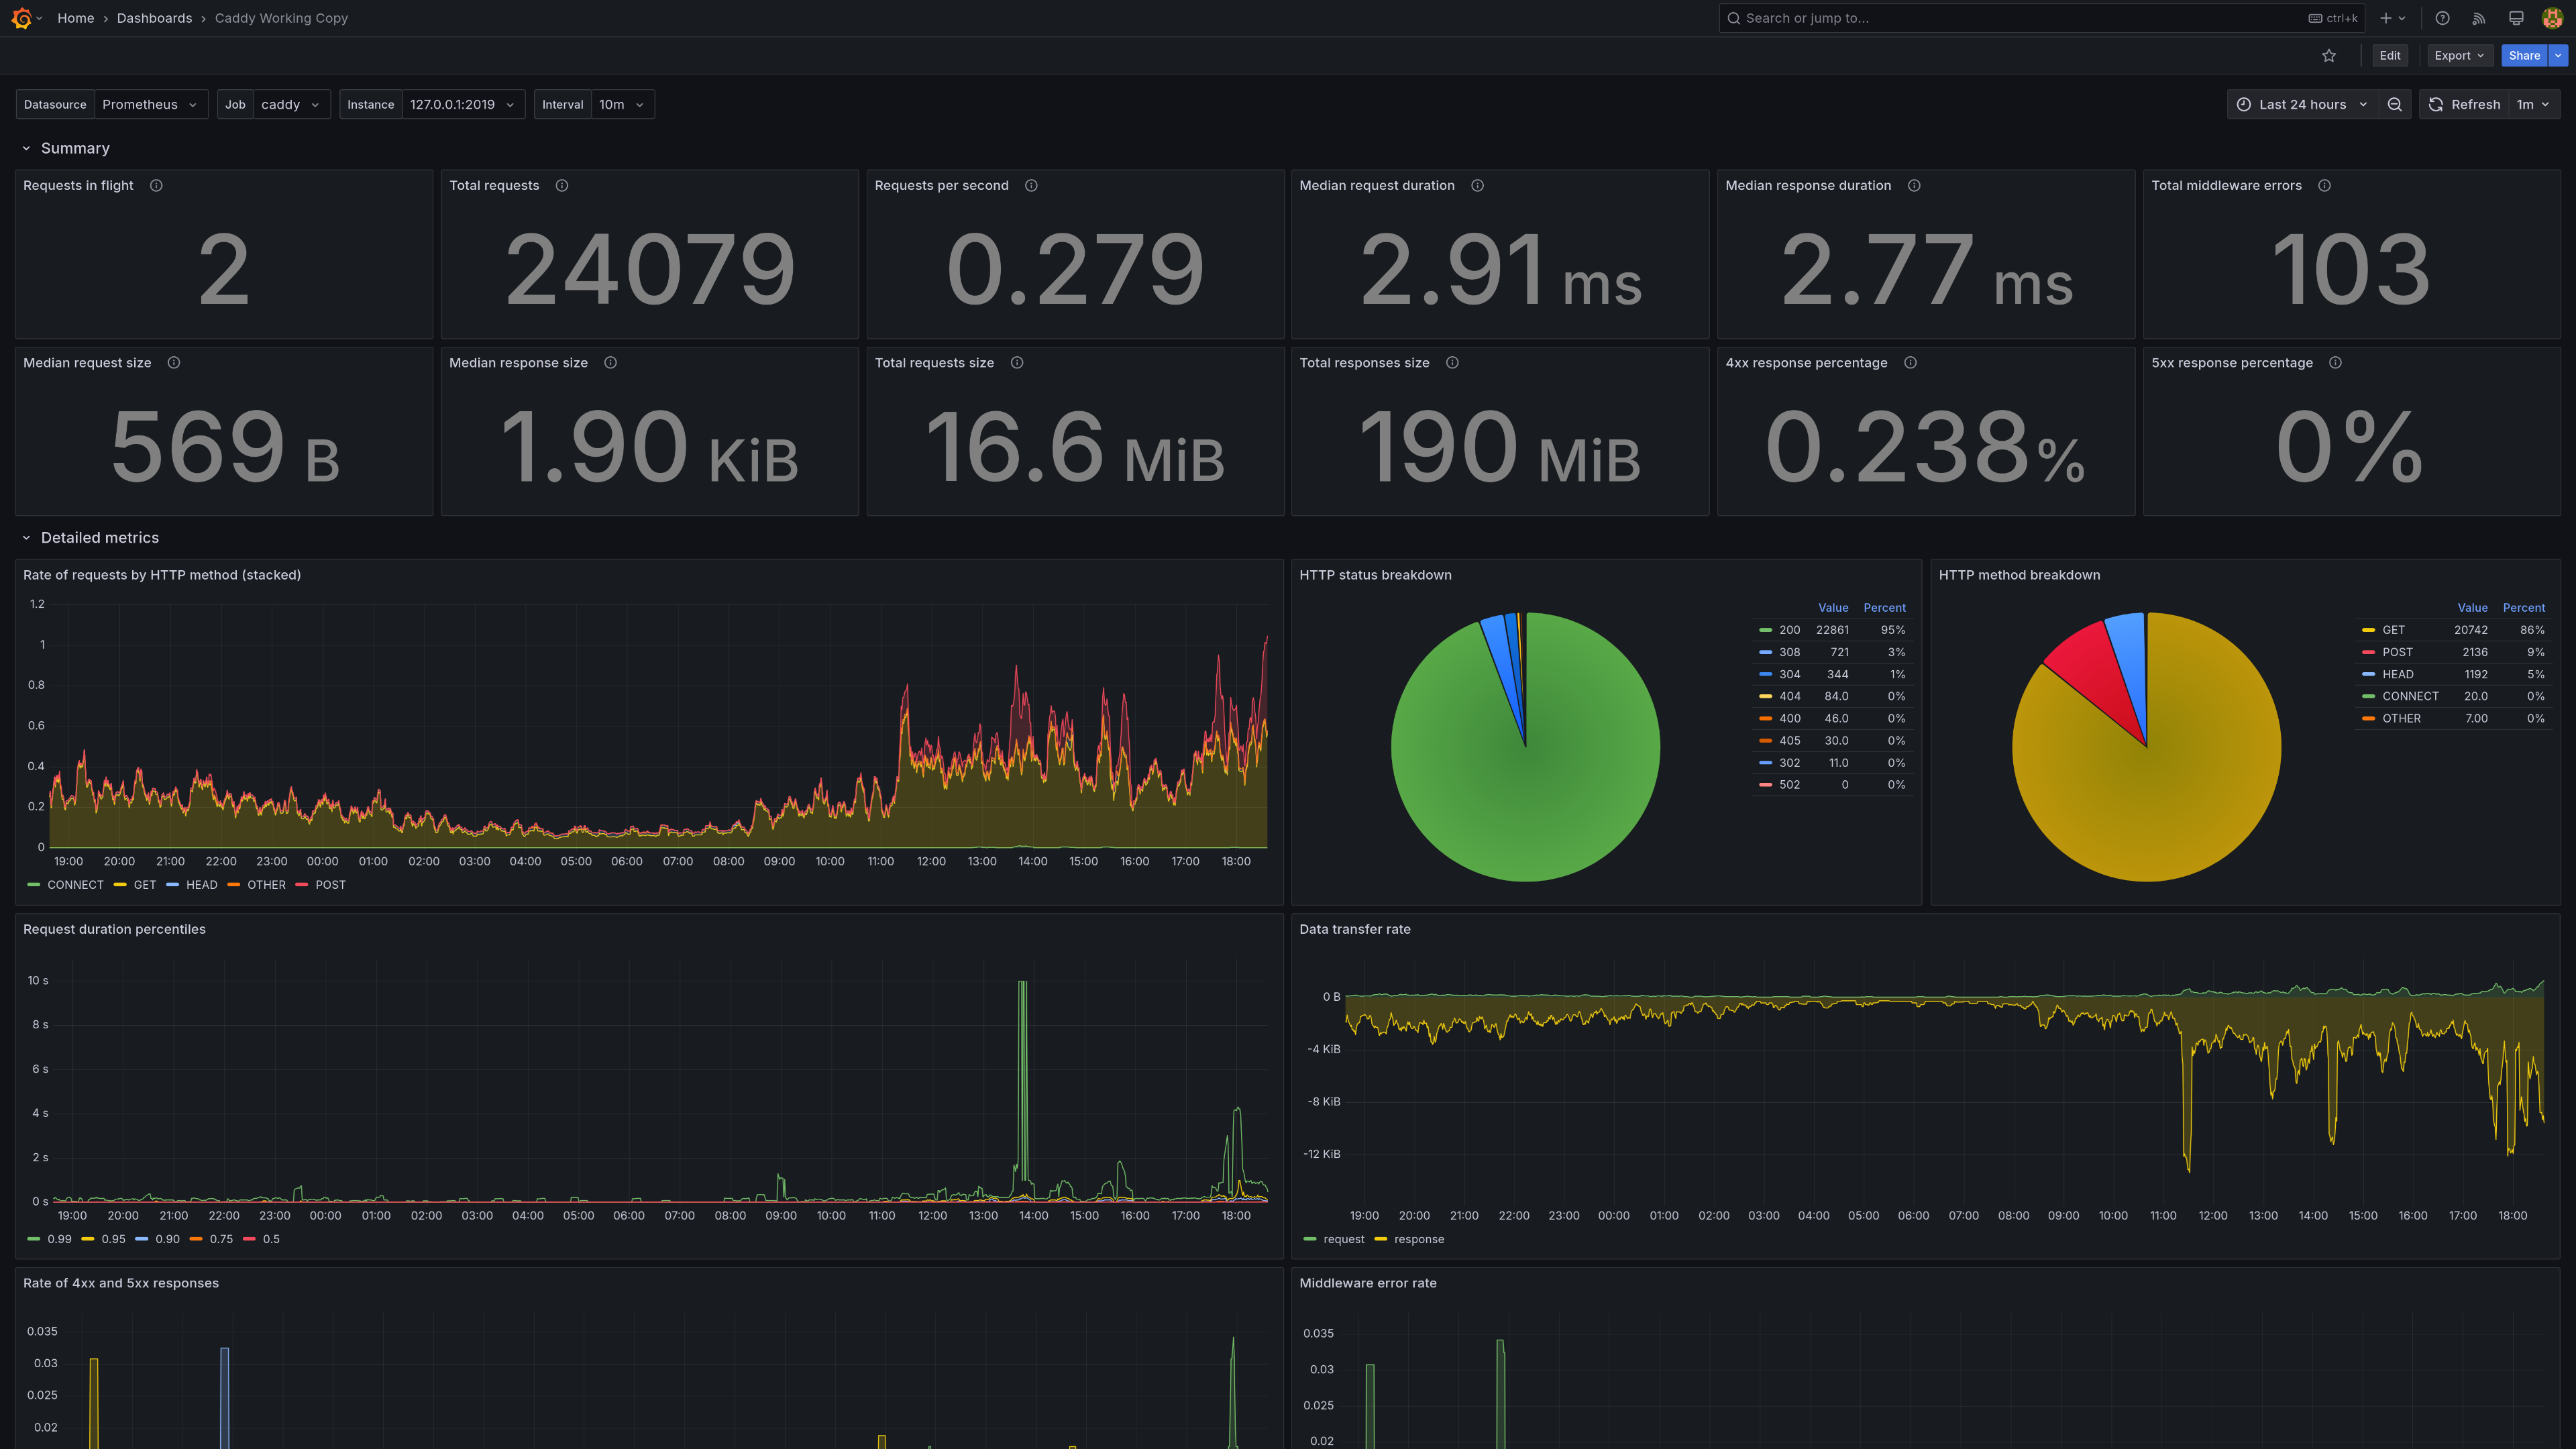
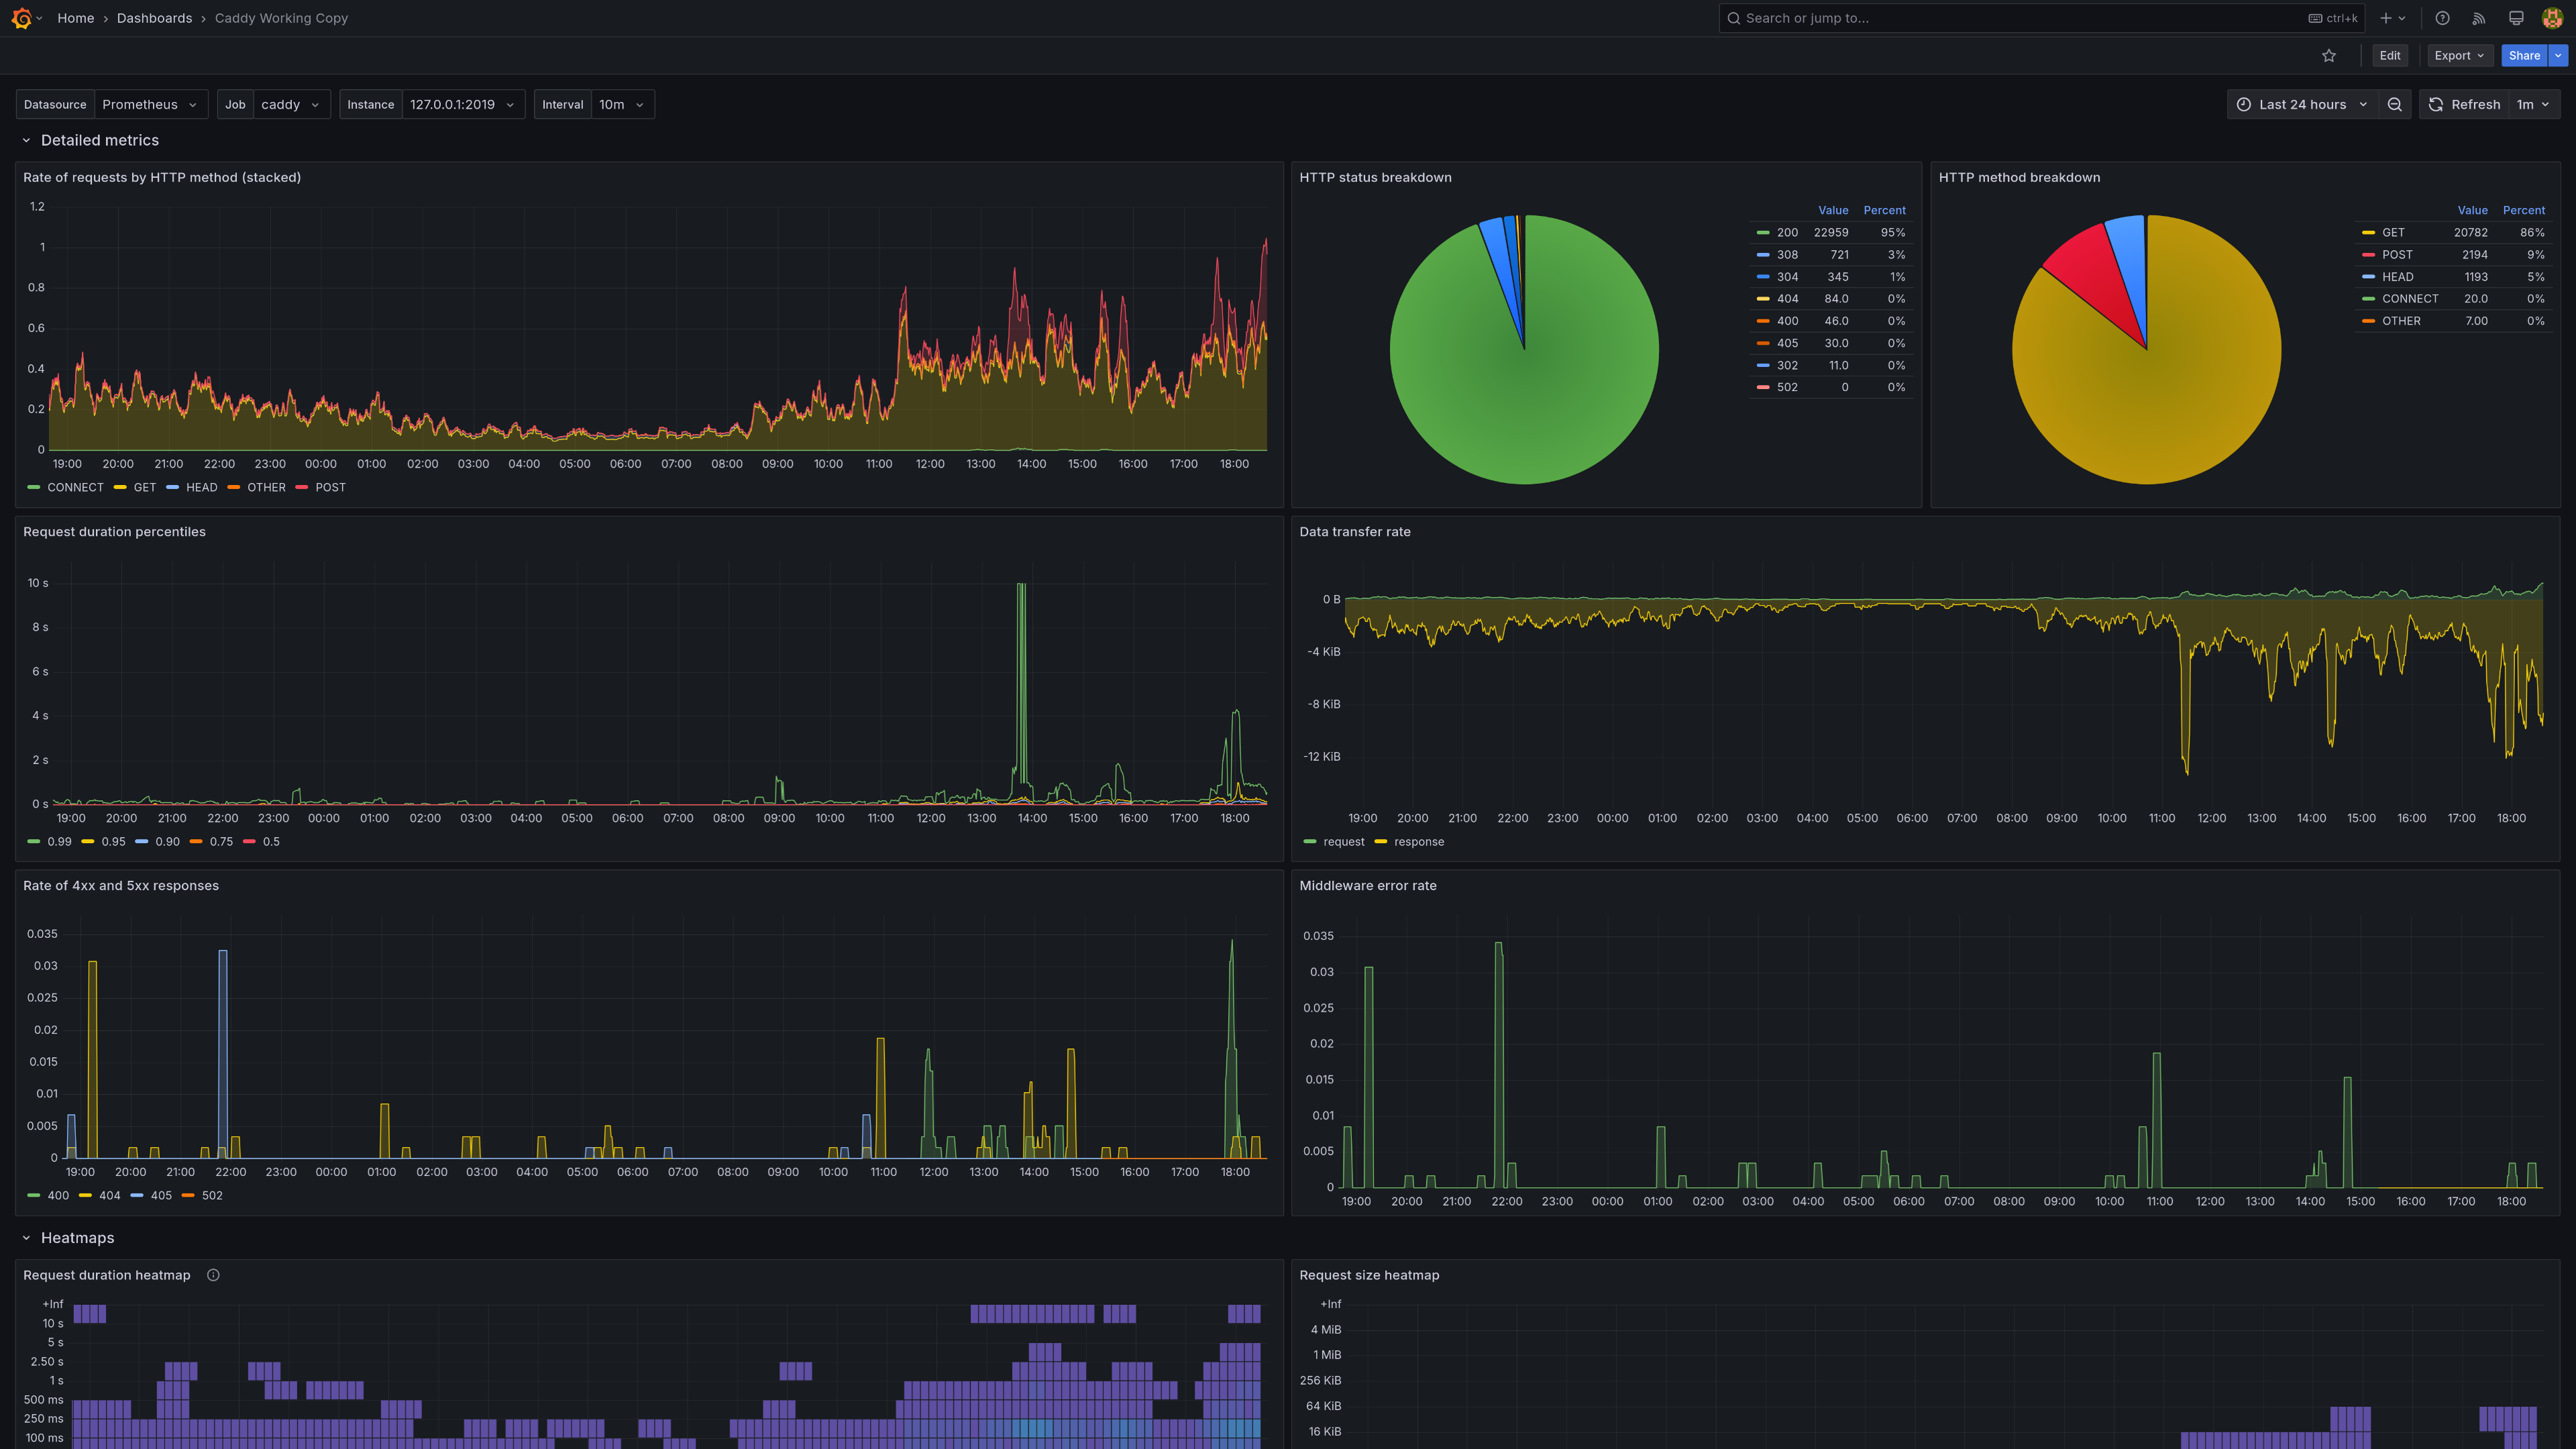
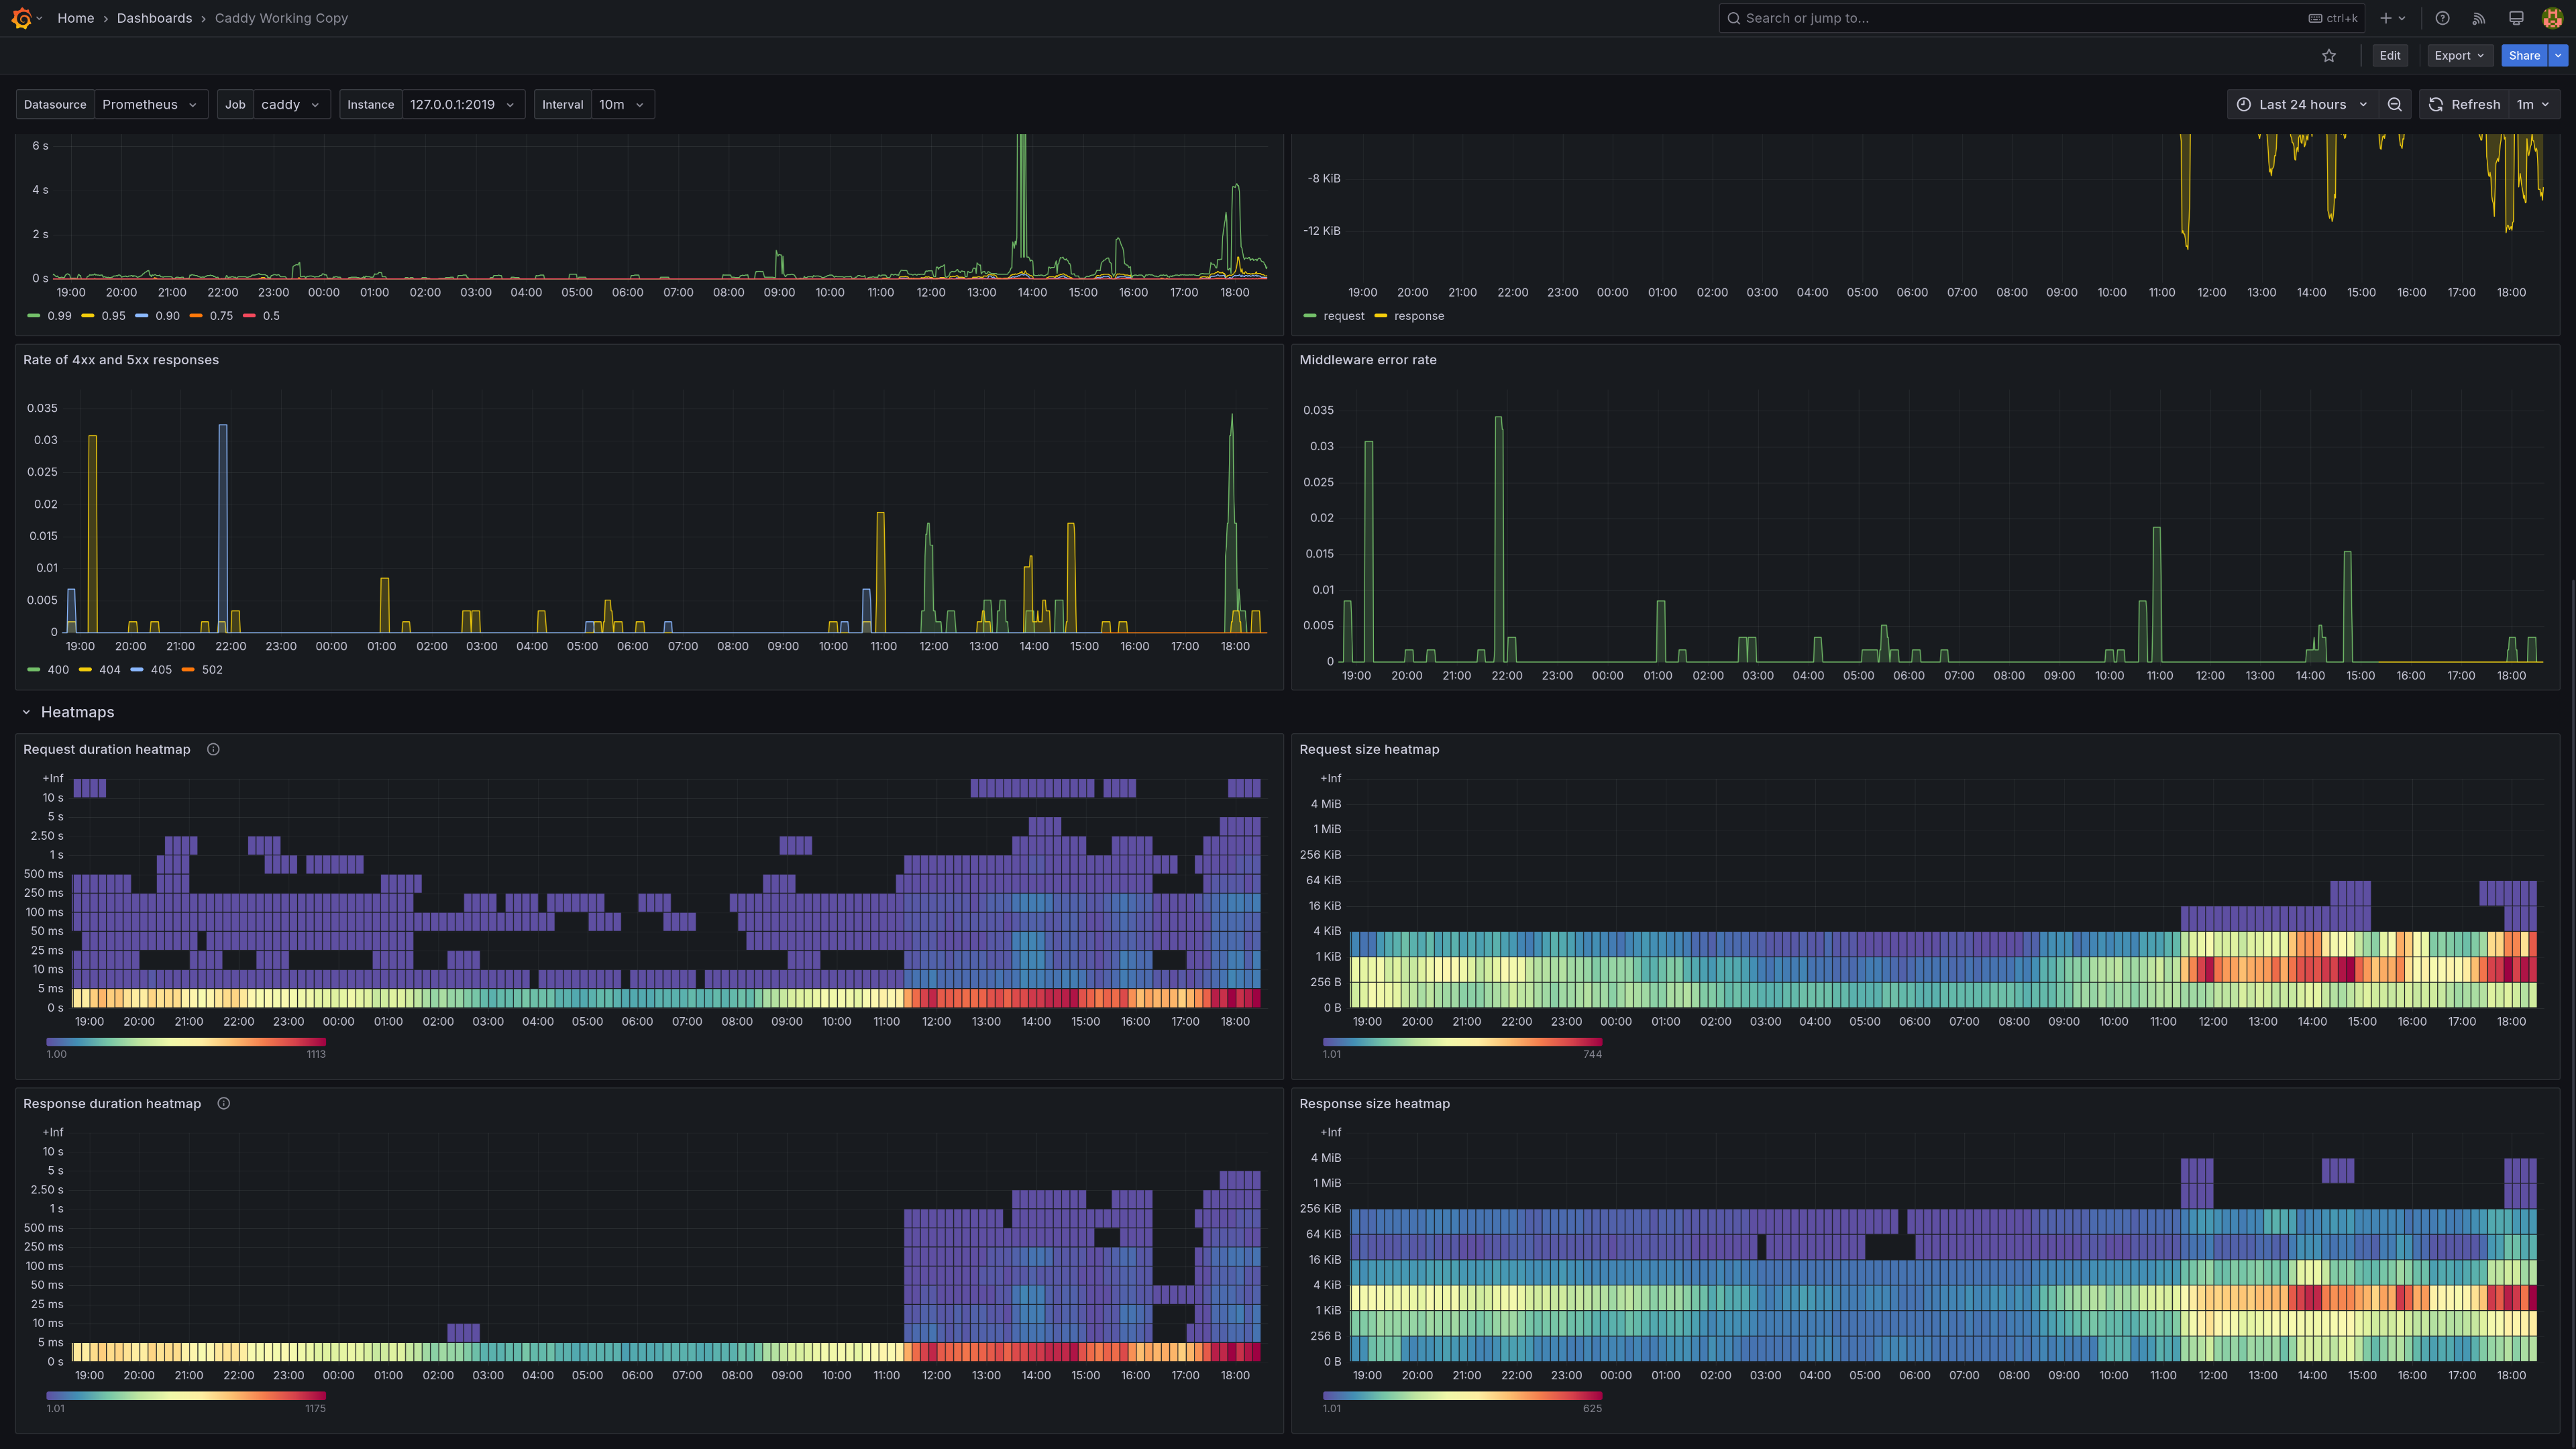
The Caddy dashboard uses the prometheus data source to create a Grafana dashboard with the heatmap, piechart, stat and timeseries panels.
Data source config
Collector type:
Collector plugins:
Collector config:
Revisions
Upload an updated version of an exported dashboard.json file from Grafana
| Revision | Description | Created | |
|---|---|---|---|
| Download |
Caddy
Easily monitor Caddy, an open source web server written in Go, with Grafana Cloud's out-of-the-box monitoring solution.
Learn more