
rbhMonitoring
Displays temperature graphs based on volume and inode count for Read/Write operations as well as Lustre's changelogs counter and the average size of files used (Read/Written/Created) using rbh-monitoring (https://github.com/LiquidSame/rbh-monitoring)

Displays temperature graphs based on volume and inode count for Read/Write operations as well as Lustre’s changelogs counter and the average size of files used (Read/Written/Created) ‘rbh-monitoring.json’ is a Grafana dashboard template (see https://grafana.com/dashboards/2276) that relies on a Graphite server that was filled using rbh-monitoring.
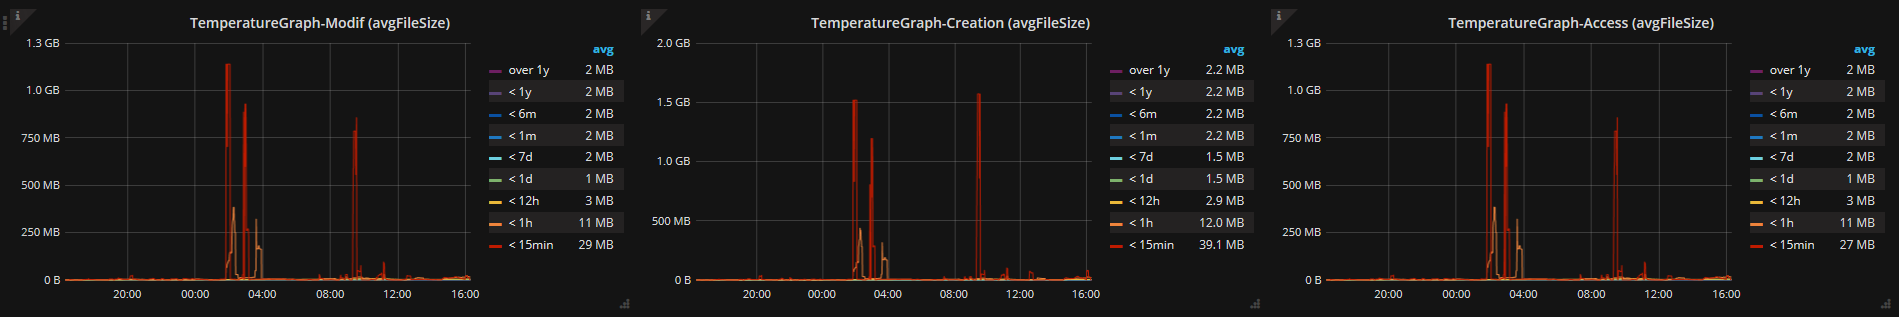
Row 1 :
  => Panel 1 : Represents the average size of files modified within given timespans.
               Obtained by dividing the total volume modified within a timespan by the
               total inode count modified within that timespan.
               "Over 1y" would represent the average size of all the files modified in the filesystem.
               An 'avg' table is shown on the right of that panel which represents
               the average size of files modified in the selected grafana timespan.

  => Panel 2 : Represents the average size of files created within given timespans.
               Obtained by dividing the total volume created within a timespan by the
               total inode count created within that timespan.
               "Over 1y" would represent the average size of all the files created in the filesystem.
               An 'avg' table is shown on the right of that panel which represents
               the average size of files created in the selected grafana timespan.

  => Panel 3 : Represents the average size of files accessed within given timespans.
               Obtained by dividing a timespan's total volume accessed by the
               total inode count accessed accessed within that timepsan.
               "Over 1y" would represent the average size of all the files accessed in the filesystem.
               An 'avg' table is shown on the right of that panel which represents
               the average size of files accessed in the selected grafana timespan.
Row 2 :
  => Panel 1 : Represents the accessed (positive y) and modified (negative y) inode count within
               given timespans. This graph only covers the activity within a week (unlike the
               temperature graph in row3-Panel1) for visibility purpose.
               Obtained by stacking a timespan's inode count accessed and modified on separate y-axis.

  => Panel 2 : Represents the accessed (positive y) and modified (negative y) volume within
               given timespans. This graph only covers the activity within a week (unlike the
               temperature graph in row3-Panel2) for visibility purpose.
               Obtained by stacking a timespan's volume accessed and modified on separate y-axis.
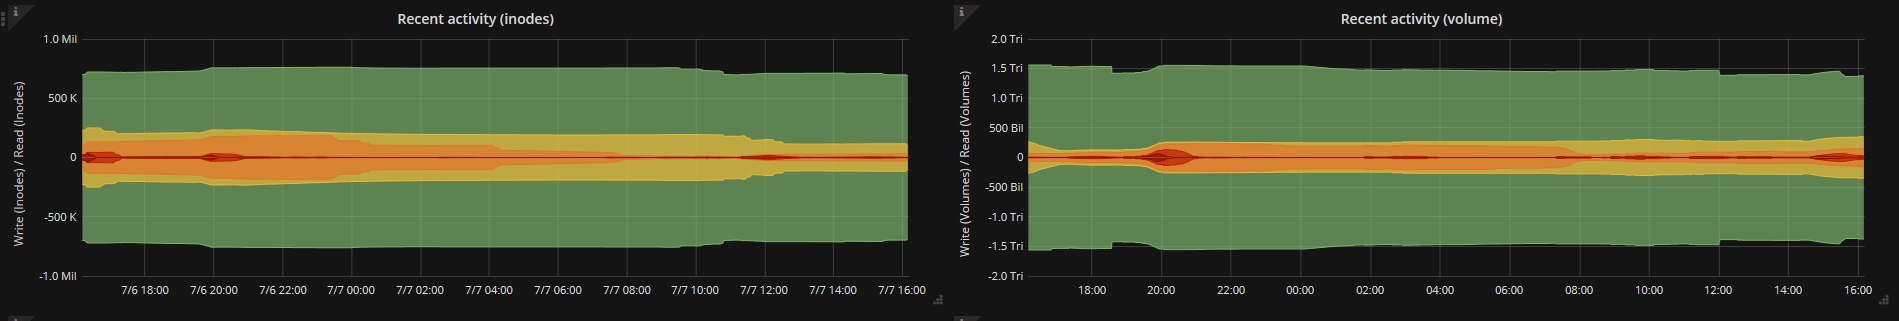
Row 3 :
  => Panel 1 : Represents the accessed and modified inode count within given timespans.
               Read operations are on the positive y-axis.
               Write operations are on the negative y-axis.
               Obtained by stacking a timespan's inode count accessed and modified on separate y-axis.

  => Panel 2 : Represents the accessed and modified volume within given timespans.
               Read operations are on the positive y-axis.
               Write operations are on the negative y-axis.
               Obtained by stacking a timespan's volume accessed and modified on separate y-axis.
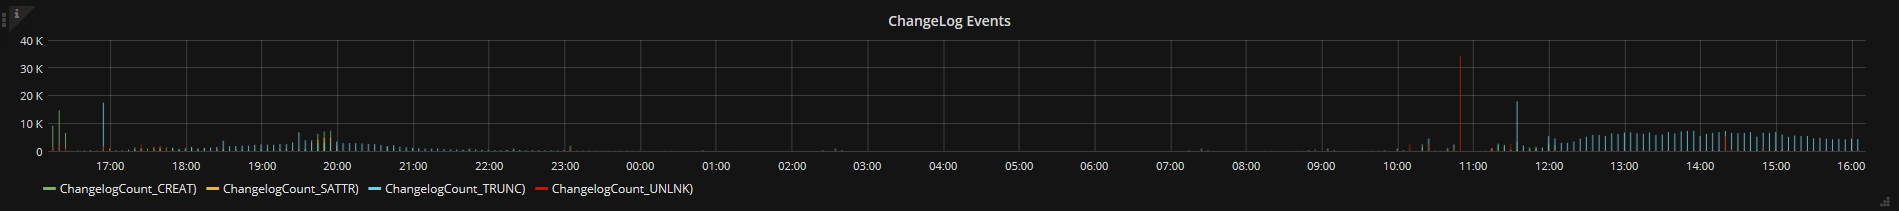
Row 4 :
  => Panel 1 : Represents the derivated changelog events counter value consumed by Robinhood.
               Obtained by derivating the queried ChangelogCount values in robinhood's db from table VARS.
               (Change the filter settings to select event types)
The easiest way to use it would be to run rbh-monitoring (https://github.com/LiquidSame/rbh-monitoring) to retrieve the metrics and visualize them here.
Data source config
Collector config:
Upload an updated version of an exported dashboard.json file from Grafana
| Revision | Description | Created | |
|---|---|---|---|
| Download |