
SMARTctl Exporter Dashboard
Extended smartctl-exporter Dashboard
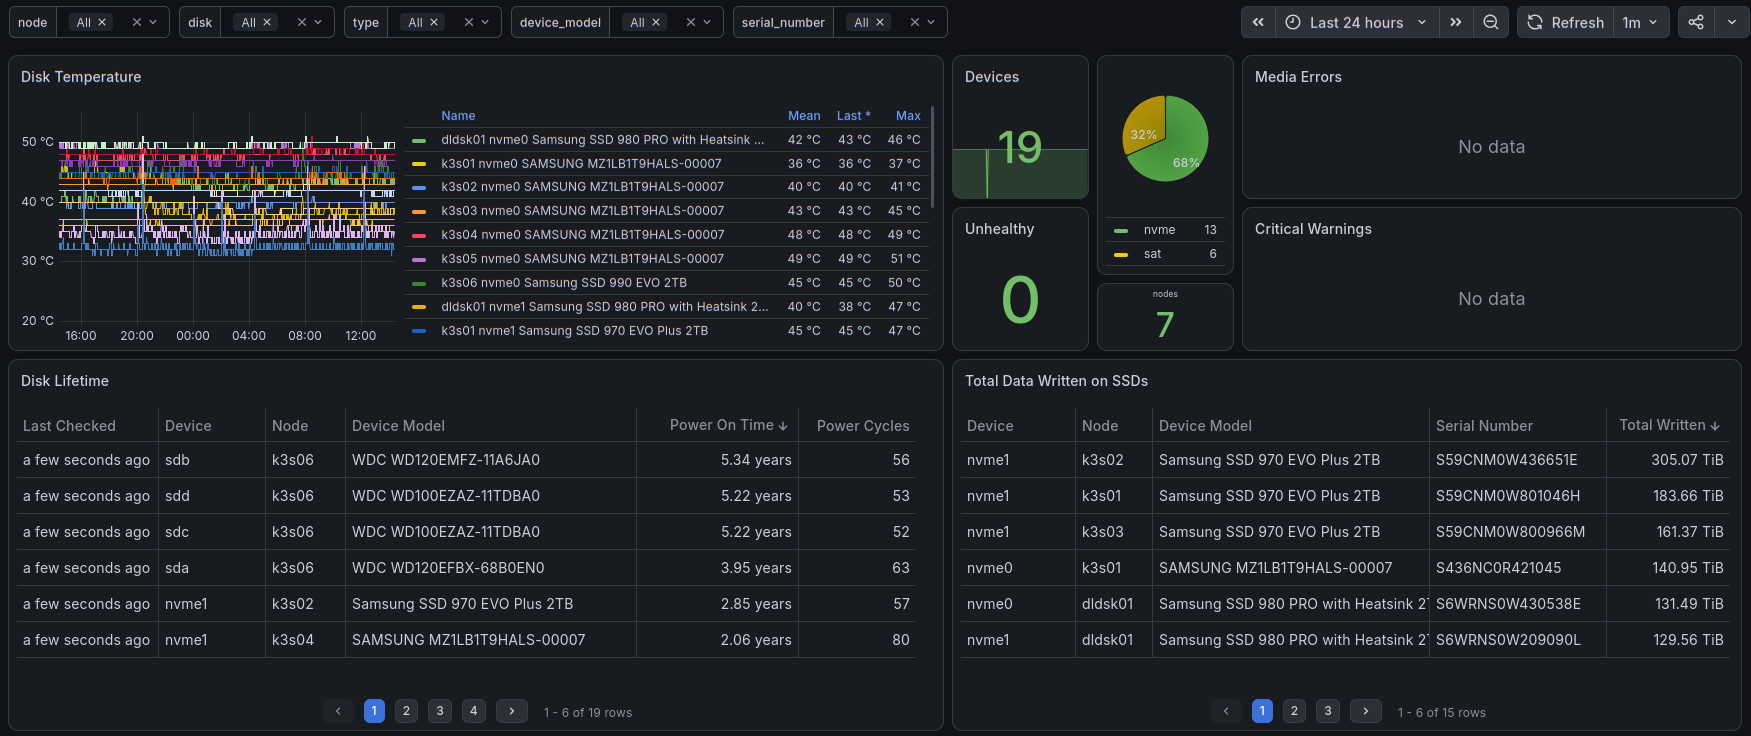
Dashboard for prometheus-community/smartctl_exporter, which wraps smartctl output for each block device into Prometheus metrics via SMART/NVMe self-monitoring data.
Panels
- Disk Temperature — per-device temperature over time, thresholded at 80°C
- Devices / Device Count by Interface (pie) — inventory of monitored devices, split by interface (
sat,nvme,scsi, etc.) - Media Errors / Critical Warnings — NVMe media error and critical warning counters, only plotted when non-zero
- Unhealthy — count of devices where
smartctl_device_smart_statusreports failed - Disk Lifetime — table of power-on hours and power-cycle count per device
- Total Data Written on SSDs — cumulative bytes written, computed from
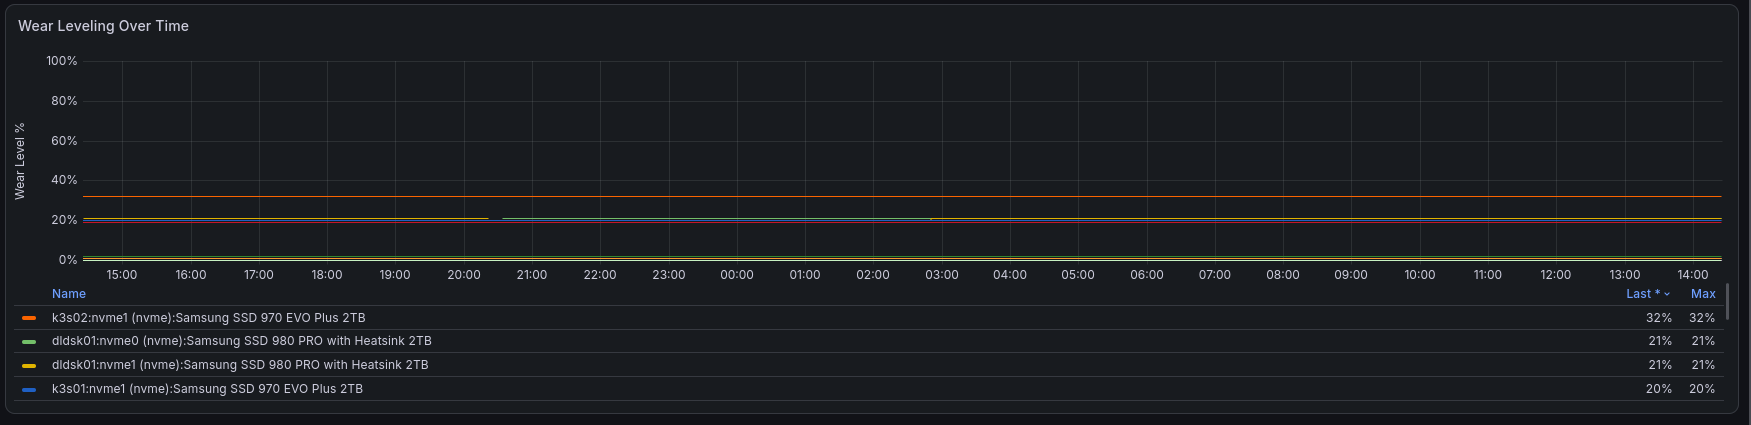
smartctl_device_bytes_writtenwhere available, falling back toTotal_LBAs_Written × logical block sizefor devices that don't expose bytes written directly - Wear Leveling Over Time — SSD wear level as a percentage over time:
100 − Wear_Leveling_Countfor SATA drives,smartctl_device_percentage_usedfor NVMe
Variables
Template variables (node, disk, type, device_model, serial_number) filter every panel down to a specific host, device, interface, model, or serial — all multi-select with "All" supported.
Data collection
Requires smartctl_exporter running with access to the target block devices (typically via a privileged container/host process, since smartctl needs raw device access) and a Prometheus scrape job pointed at it:
```yaml scrape_configs:
- job_name: smartctl-exporter
static_configs:
- targets: ['smartctl-exporter:9633'] ```
No CollectD involved — this exporter talks directly to smartctl and exposes /metrics for Prometheus scraping.
NOTE: Revision 4 filters the temperature query with temperature_type=~"current|". This works with exporter 0.15.0 and newer, and with older versions that do not have the temperature_type label.
Data source config
Collector config:
Upload an updated version of an exported dashboard.json file from Grafana
| Revision | Description | Created | |
|---|---|---|---|
| Download |