
System and Containers Monitoring and Logs
Host, Docker container metrics and logs per host, collected by Grafana Alloy into Prometheus/Mimir + Loki. v2: per-host filtering, CPU by mode, PSI, filesystems, container table, log search.
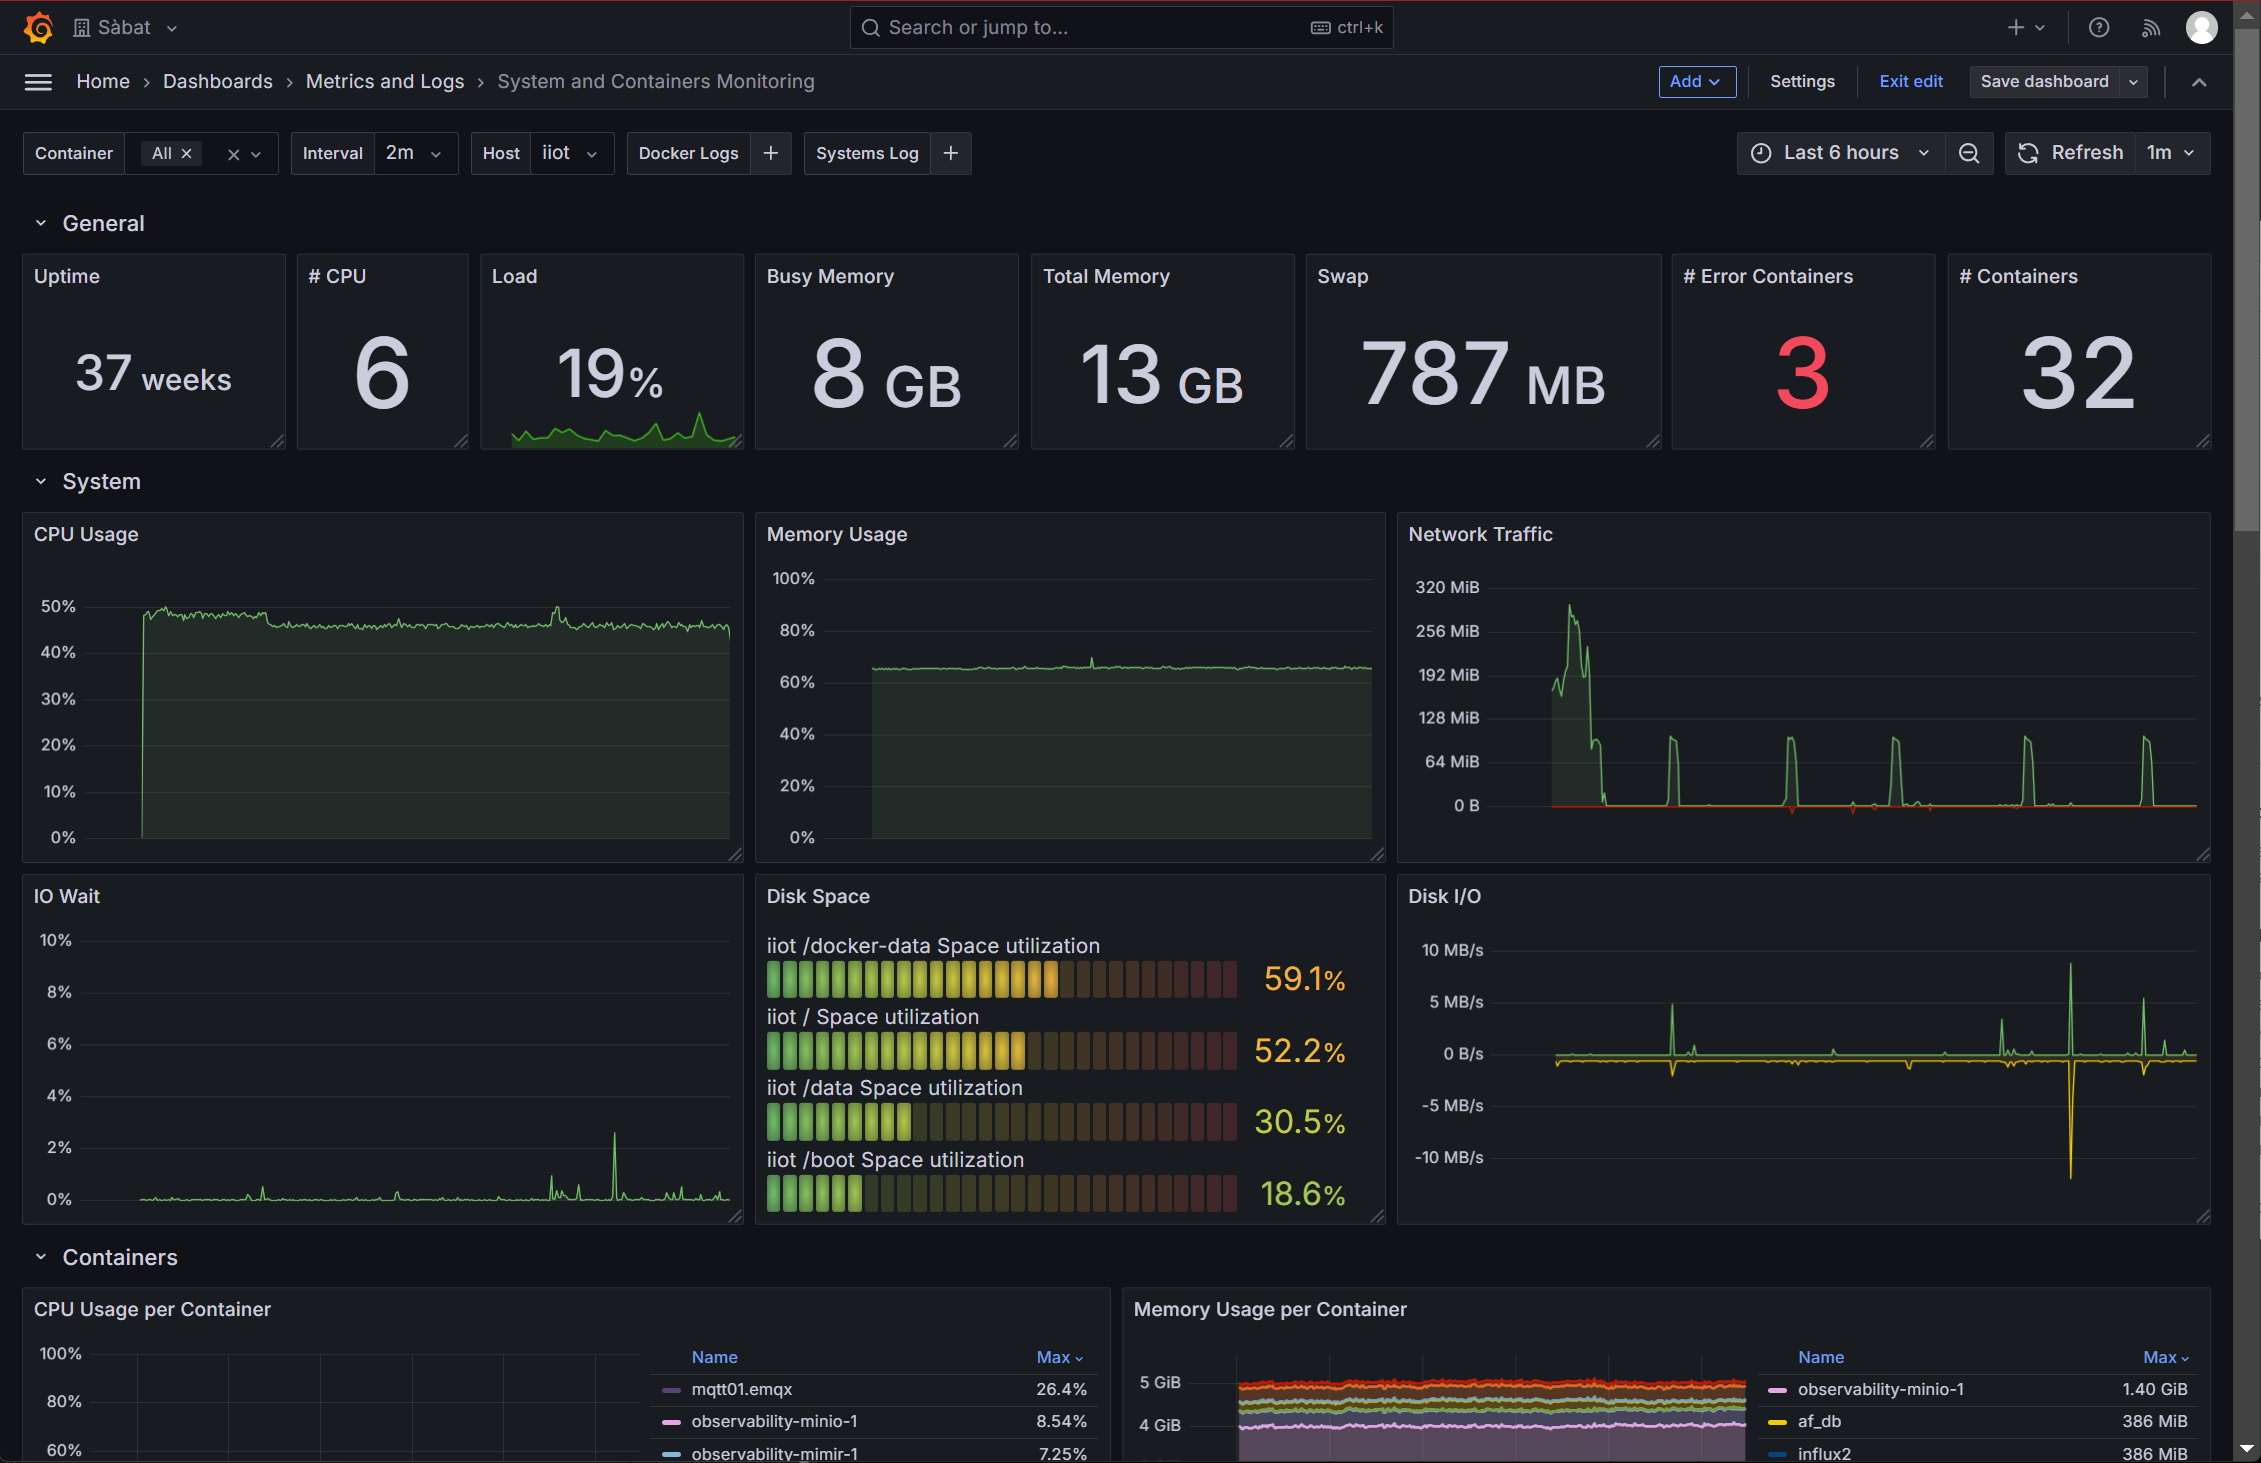
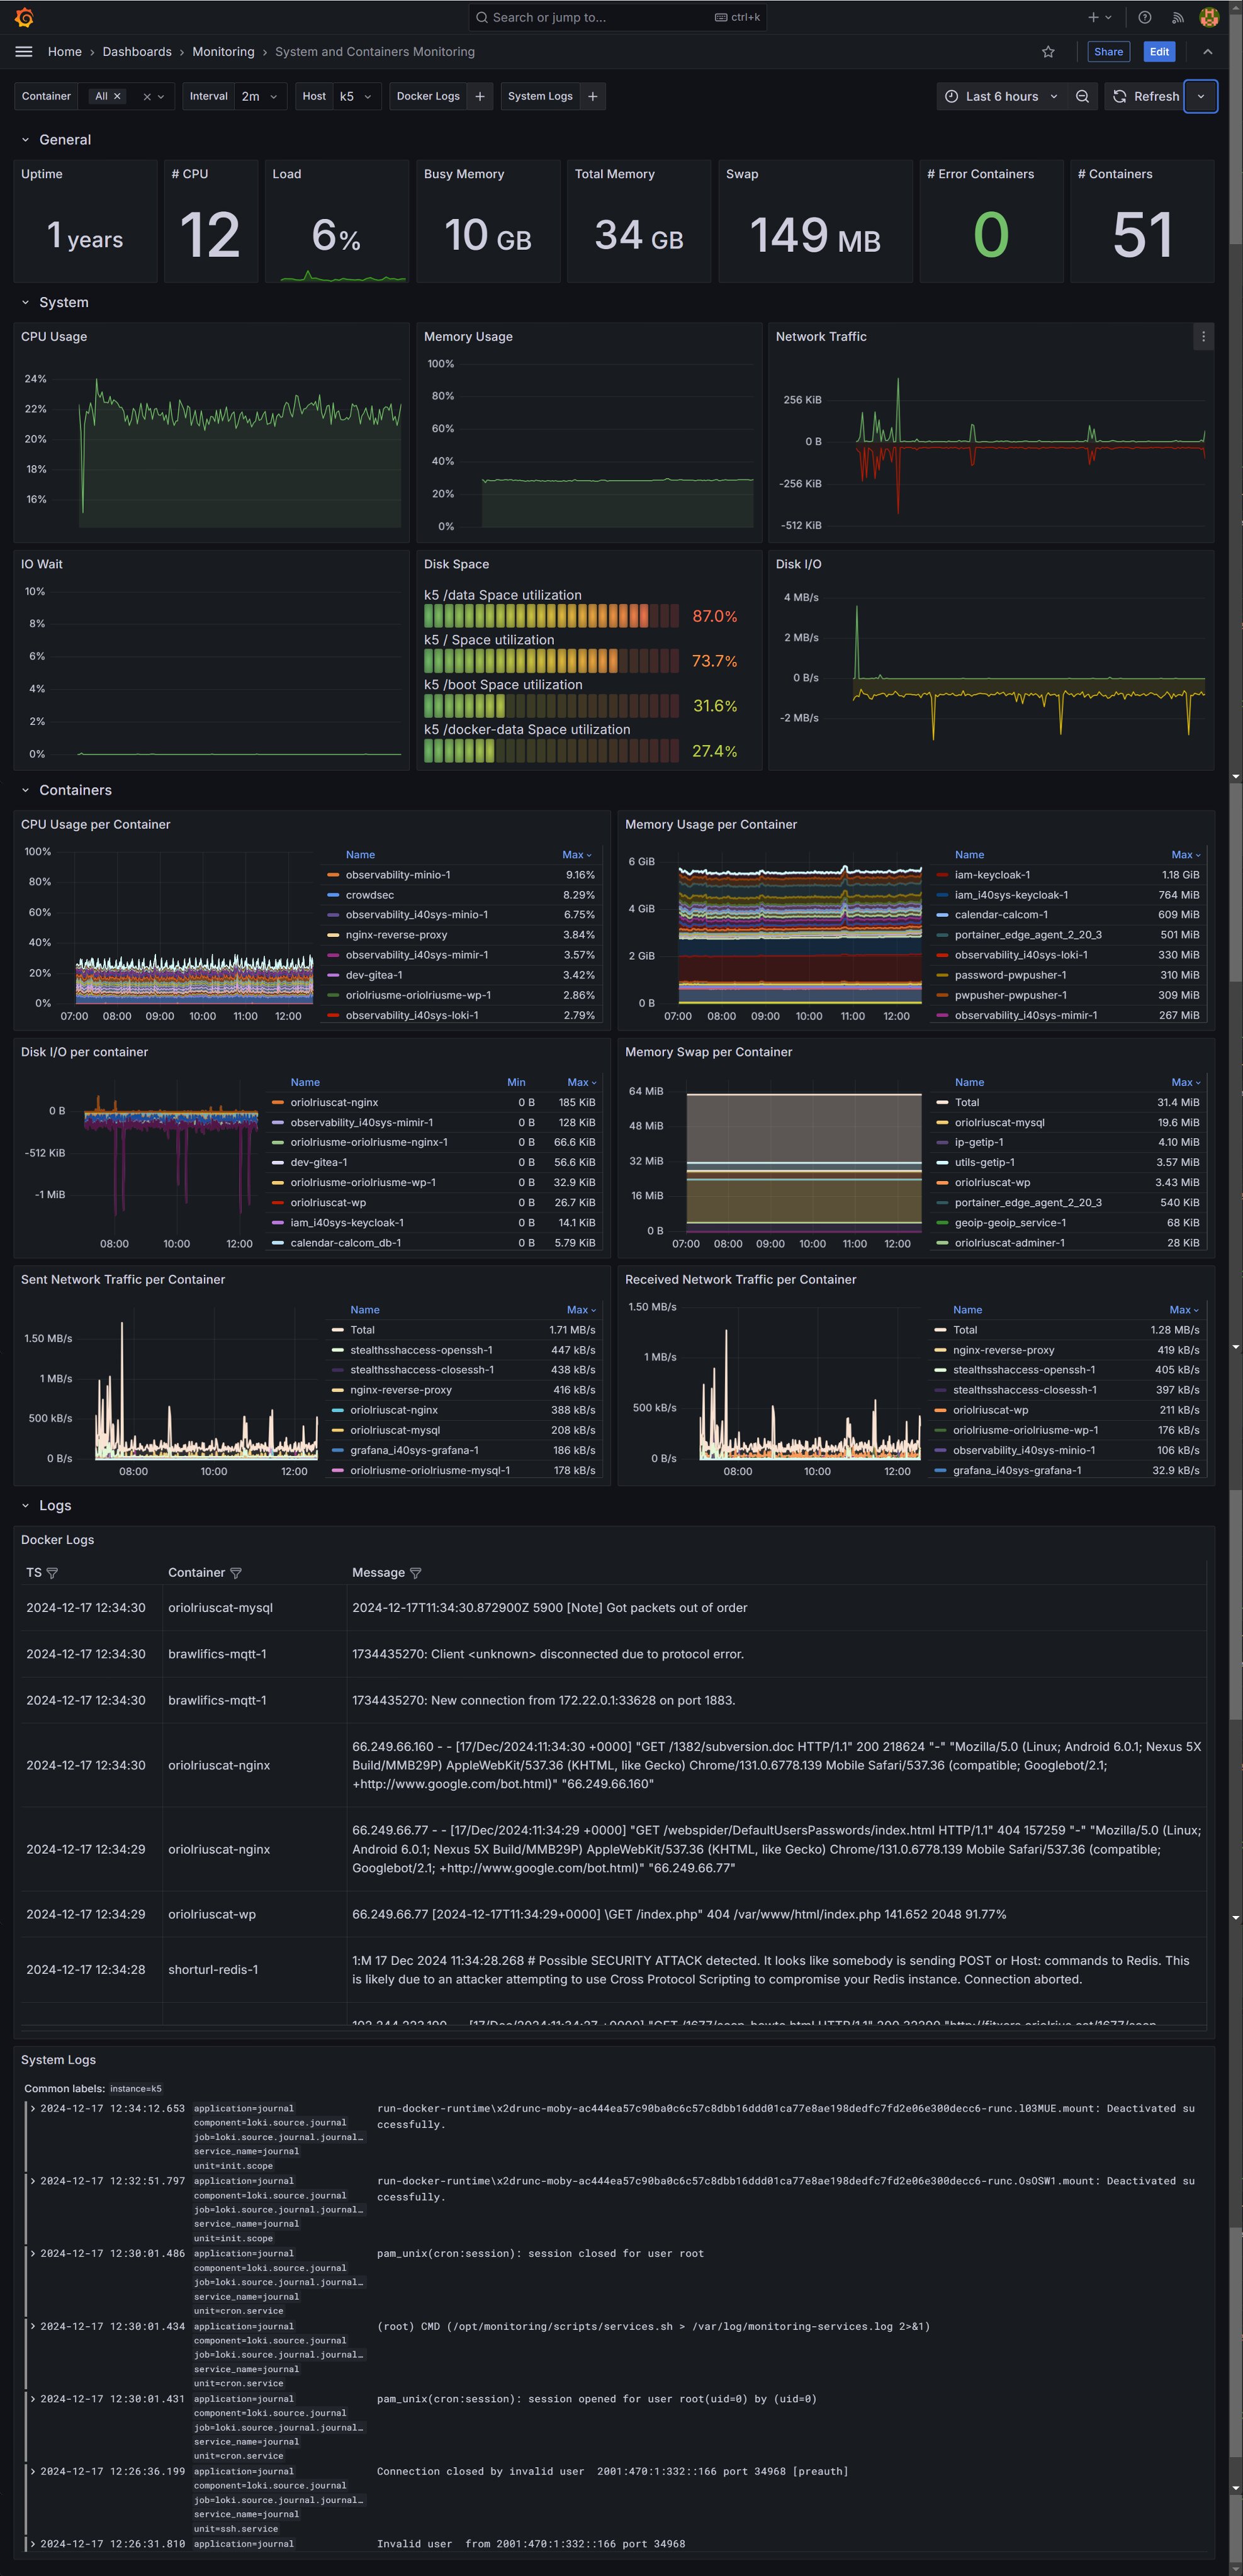
Host, Docker container metrics and logs in one dashboard. Pick a host and you get its CPU, memory, pressure, network, disks and filesystems, every container's CPU, memory, I/O and network, and the container and systemd journal logs, with a text search.
Everything is collected by Grafana Alloy on each host. Metrics go to any Prometheus-compatible store (Grafana Mimir, Prometheus) and logs to Grafana Loki.
Requirements
- Grafana 11 or later.
- A Prometheus-compatible datasource and a Loki datasource. They are chosen with the dashboard's Metrics and Logs variables.
- Grafana Alloy on every host, using the same labels everywhere. See below.
- Optional: docker_container_exporter, for the count of containers that are not running. cAdvisor only sees running containers.
Labels the dashboard expects
| Source | Alloy component | Labels |
|---|---|---|
Host metrics node_* | prometheus.exporter.unix | instance = host name |
Container metrics container_* | prometheus.exporter.cadvisor | instance = host name, name = container |
Container counts docker_containers_* | scrape of docker_container_exporter | instance = host name |
| Container logs | loki.source.docker | application="docker", instance, container_name |
| Journal | loki.source.journal | application="journal", instance, unit |
The Host variable lists label_values(node_uname_info, instance). Use the same instance value in
every source of a host.
Minimal Alloy configuration (one host)
// --- metrics ---------------------------------------------------------------
prometheus.exporter.unix "host" { }
discovery.relabel "host" {
targets = prometheus.exporter.unix.host.targets
rule {
target_label = "instance"
replacement  = constants.hostname
}
}
prometheus.scrape "host" {
targets    = discovery.relabel.host.output
forward_to = [prometheus.remote_write.default.receiver]
}
prometheus.exporter.cadvisor "containers" {
docker_host      = "unix:///var/run/docker.sock"
storage_duration = "1m"
}
prometheus.scrape "cadvisor" {
targets    = prometheus.exporter.cadvisor.containers.targets
forward_to = [prometheus.relabel.cadvisor.receiver]
}
// cAdvisor copies every docker label into container_label_: too many labels per series
// (Mimir rejects more than 30 by default) and new series on every redeploy. Keep only
// the compose project/service.
prometheus.relabel "cadvisor" {
forward_to = [prometheus.remote_write.default.receiver]
rule {
source_labels = ["container_label_com_docker_compose_project"]
target_label  = "compose_project"
}
rule {
source_labels = ["container_label_com_docker_compose_service"]
target_label  = "compose_service"
}
rule {
regex  = "container_label_."
action = "labeldrop"
}
rule {
target_label = "instance"
replacement  = constants.hostname
}
}
// optional: github.com/oriolrius/docker_container_exporter on :8118
prometheus.scrape "container_counts" {
targets    = [{"address" = "127.0.0.1:8118", "instance" = constants.hostname}]
forward_to = [prometheus.remote_write.default.receiver]
}
prometheus.remote_write "default" {
endpoint {
url = "http://mimir:8080/api/v1/push"      // or Prometheus /api/v1/write
}
}
// — logs ——————————————————————
discovery.docker "containers" {
host = "unix:///var/run/docker.sock"
}
discovery.relabel "docker_logs" {
targets = []
rule {
source_labels = ["__meta_docker_container_name"]
regex         = "/(.*)"
target_label  = "container_name"
}
rule {
target_label = "instance"
replacement  = constants.hostname
}
rule {
target_label = "application"
replacement  = "docker"
}
}
loki.source.docker "containers" {
host          = "unix:///var/run/docker.sock"
targets       = discovery.docker.containers.targets
relabel_rules = discovery.relabel.docker_logs.rules
forward_to    = [loki.write.default.receiver]
}
loki.relabel "journal" {
forward_to = []
rule {
source_labels = ["__journal__systemd_unit"]
target_label  = "unit"
}
rule {
target_label = "instance"
replacement  = constants.hostname
}
rule {
target_label = "application"
replacement  = "journal"
}
}
loki.source.journal "host" {
relabel_rules = loki.relabel.journal.rules
forward_to    = [loki.write.default.receiver]
}
loki.write "default" {
endpoint {
url = "http://loki:3100/loki/api/v1/push"
}
}
Running Alloy in a container instead of as a service
The container needs access to the host. Configure it as follows.
Mount the host paths:
/proc:/host/proc:ro,/sys:/host/sys:roand/:/host/root:ro,rslave. Then setprocfs_path,sysfs_pathandrootfs_pathonprometheus.exporter.unix./var/run/docker.sock,/sys:/sys:ro, the Docker data root (e.g./var/lib/docker) and/dev/disk(all read-only), for cAdvisor./var/log/journaland/etc/machine-id, for the journal.
Run it with pid: host. Without it, cAdvisor reports no per-container network traffic.
If the container is not on the host network, host network counters need a second
exporter, because /proc/net/dev shows the reader's own network namespace:
prometheus.exporter.unix "host_net" {
  procfs_path    = "/host/proc/1"
  set_collectors = ["netdev"]
}
Hosts with many containers
cAdvisor uses inotify. If Alloy logs inotify_init: too many open files, raise
fs.inotify.max_user_instances (e.g. to 1024 in /etc/sysctl.d/).
Revision 2 (2026-10)
- Every panel is filtered by the selected host. Several revision 1 panels mixed all hosts.
- Datasources are variables (Metrics, Logs). There are no hard-coded uids, and a
single Loki is used: the
applicationlabel tells container logs from journal logs. - Host CPU is broken down by mode. Revision 1 summed container system time.
- Memory is broken down into used, cache and buffers, free, and swap.
- New panels:
- Linux pressure (PSI) for CPU, memory and IO;
- a filesystems table with size, free space and free %;
- a per-container table (CPU, RSS, swap);
- text search for the logs;
- a host reboot annotation.
- Network and disk I/O are mirrored: in/read up, out/write down.
- The Windows leftovers and the manual
intervalvariable are gone;$__rate_intervalis used instead.
Data source config
Collector config:
Upload an updated version of an exported dashboard.json file from Grafana
| Revision | Description | Created | |
|---|---|---|---|
| Download |

Grafana Loki (self-hosted)

Easily monitor Grafana Loki (self-hosted), a horizontally scalable, highly available, multi-tenant log aggregation system inspired by Prometheus, with Grafana Cloud's out-of-the-box monitoring solution.
Learn more