SView tomcat
jmx exporter monitor
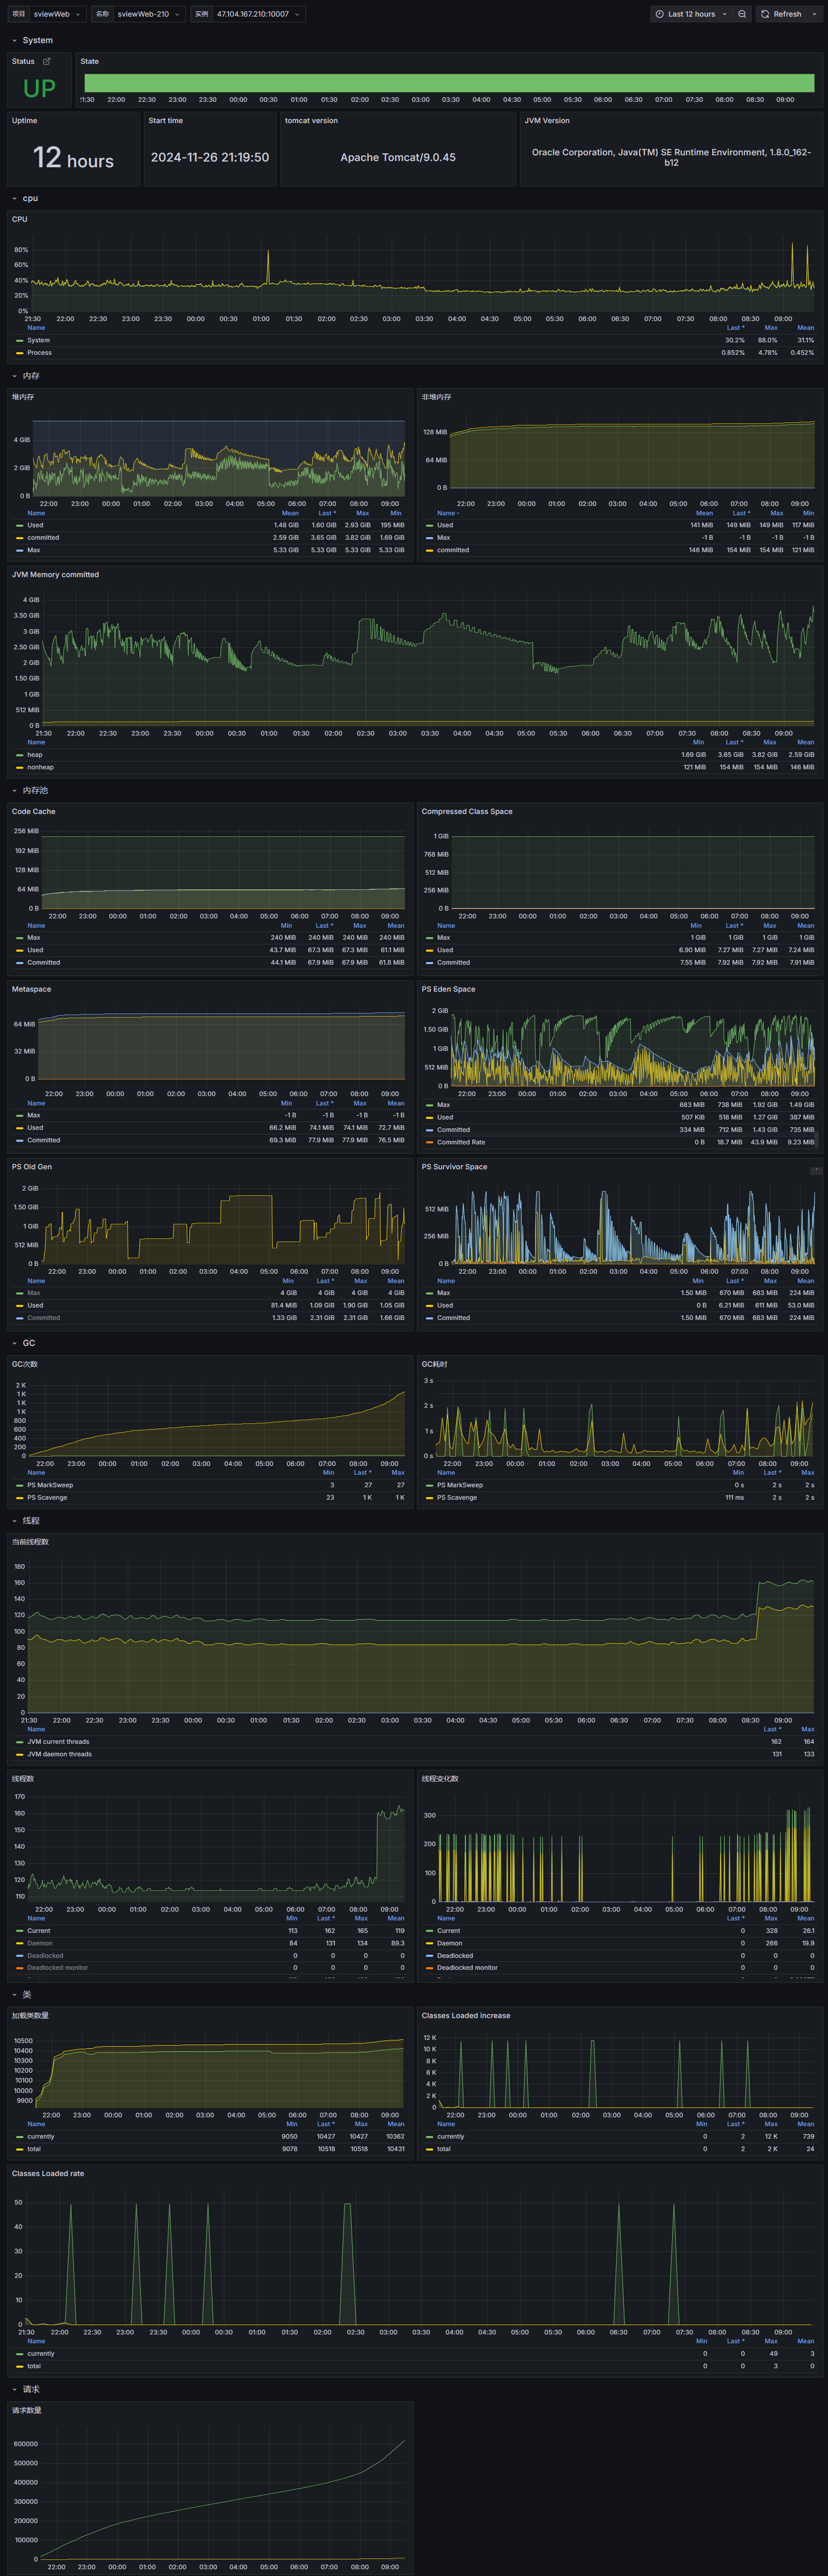
这是一个基于prometheus、jmx_exporter-1.0.1的tomcat基本仪表盘
最上面项目、名称是我自己增加了信息,如没有请去除 jmx_exporter配置如下
# https://grafana.com/grafana/dashboards/8704-tomcat-dashboard/
---
lowercaseOutputLabelNames: true
lowercaseOutputName: true
whitelistObjectNames: ["java.lang:type=OperatingSystem", "Catalina:*"]
blacklistObjectNames: []
rules:
  - pattern: 'Catalina<type=Server><>serverInfo: (.+)'
    name: tomcat_serverinfo
    value: 1
    labels:
      serverInfo: "$1"
    type: COUNTER
  - pattern: 'Catalina<type=GlobalRequestProcessor, name=\"(\w+-\w+)-(\d+)\"><>(\w+):'
    name: tomcat_$3_total
    labels:
      port: "$2"
      protocol: "$1"
    help: Tomcat global $3
    type: COUNTER
  - pattern: 'Catalina<j2eeType=Servlet, WebModule=//([-a-zA-Z0-9+&@#/%?=~_|!:.,;]*[-a-zA-Z0-9+&@#/%=~_|]), name=([-a-zA-Z0-9+/$%~_-|!.]*), J2EEApplication=none, J2EEServer=none><>(requestCount|processingTime|errorCount):'
    name: tomcat_servlet_$3_total
    labels:
      module: "$1"
      servlet: "$2"
    help: Tomcat servlet $3 total
    type: COUNTER
  - pattern: 'Catalina<type=ThreadPool, name="(\w+-\w+)-(\d+)"><>(currentThreadCount|currentThreadsBusy|keepAliveCount|connectionCount|acceptCount|acceptorThreadCount|pollerThreadCount|maxThreads|minSpareThreads):'
    name: tomcat_threadpool_$3
    labels:
      port: "$2"
      protocol: "$1"
    help: Tomcat threadpool $3
    type: GAUGE
  - pattern: 'Catalina<type=Manager, host=([-a-zA-Z0-9+&@#/%?=~_|!:.,;]*[-a-zA-Z0-9+&@#/%=~_|]), context=([-a-zA-Z0-9+/$%~_-|!.]*)><>(processingTime|sessionCounter|rejectedSessions|expiredSessions):'
    name: tomcat_session_$3_total
    labels:
      context: "$2"
      host: "$1"
    help: Tomcat session $3 total
    type: COUNTER
Data source config
Collector type:
Collector plugins:
Collector config:
Revisions
Upload an updated version of an exported dashboard.json file from Grafana
| Revision | Description | Created | |
|---|---|---|---|
| Download |
Apache Tomcat
Easily monitor Apache Tomcat, an open source web server and servlet container that can run Java-based web applications, with Grafana Cloud's out-of-the-box monitoring solution.
Learn more