K8s Node Metrics / Multi Clusters (Node Exporter, Prometheus, Grafana13, 2026, EN)
About: K8s Node Metrics / Multi Clusters
- A multi-cluster node monitoring dashboard.
- Provides node-exporter metrics with multi-datasource (Prometheus) support.
- English UI.
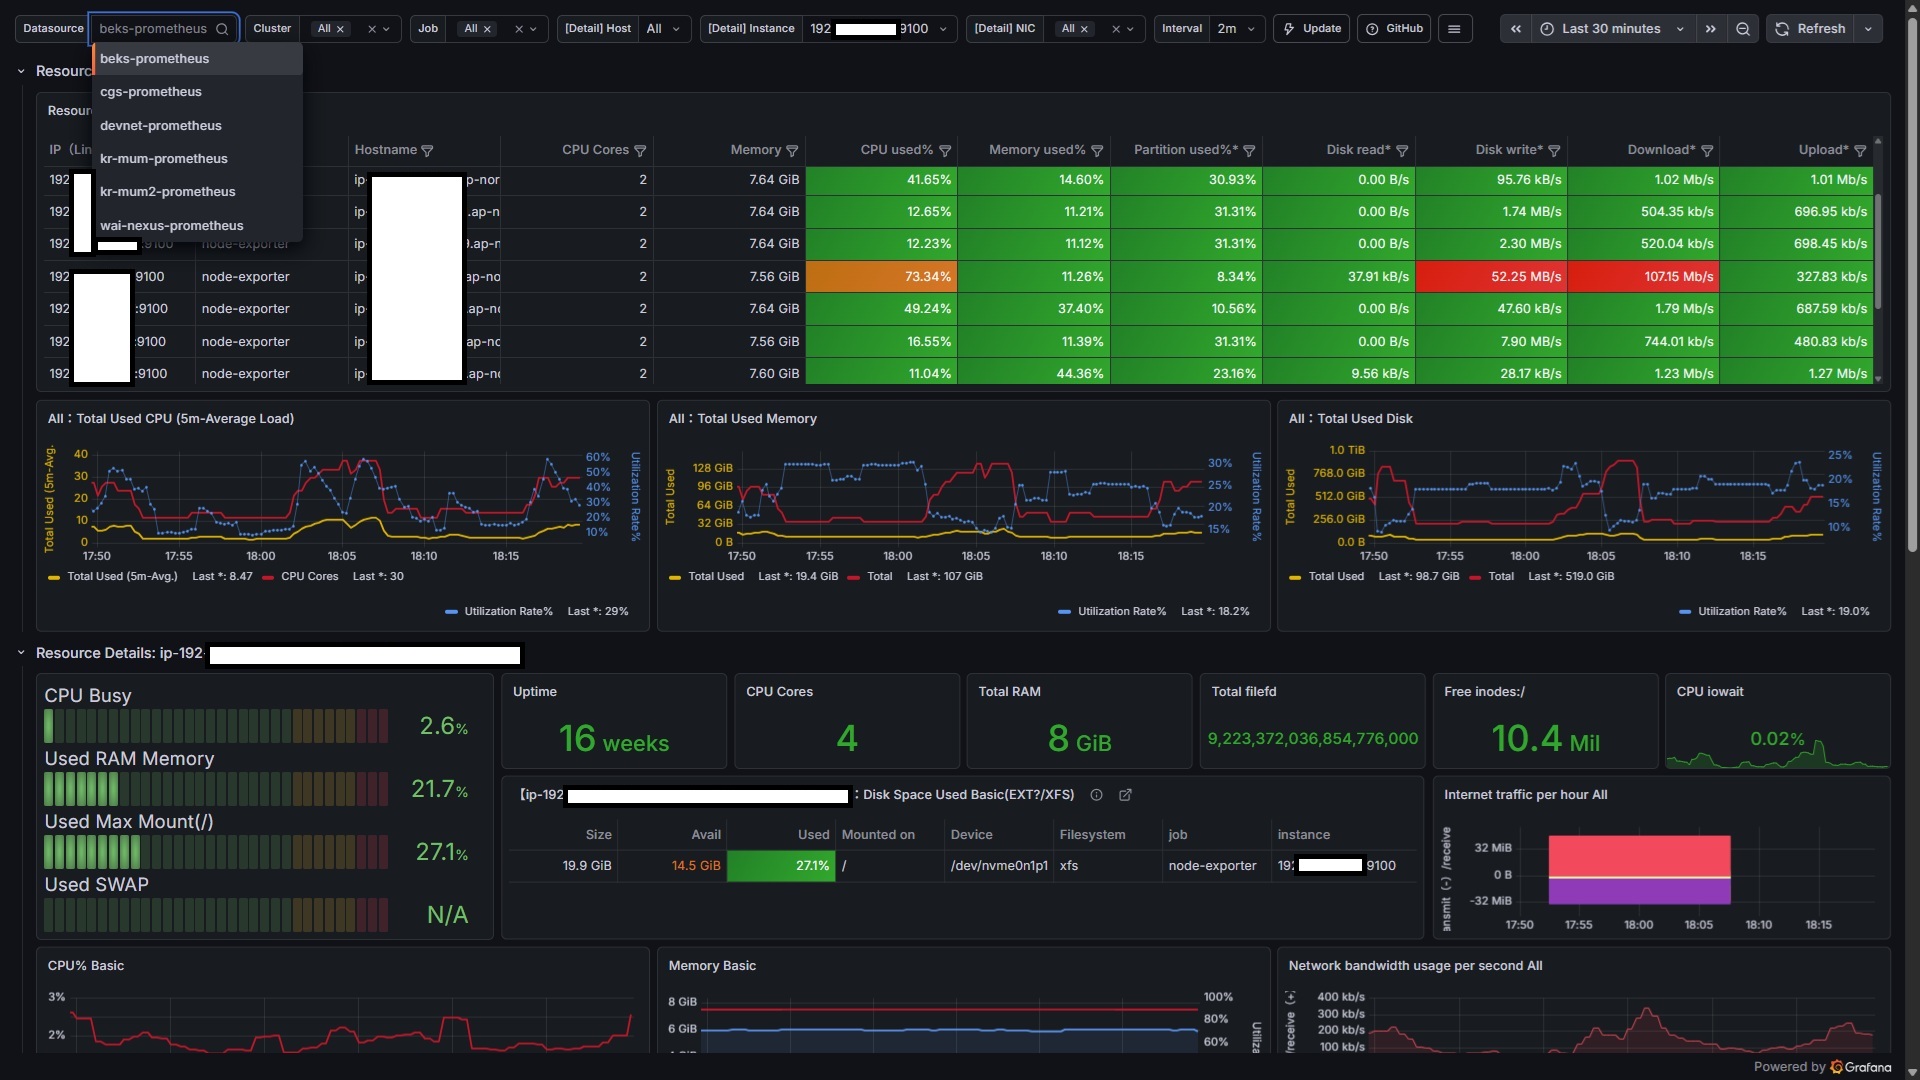
Variables
Datasource: select a Prometheus datasource registered in Grafana.Cluster: filters by theclusterPrometheus metric label- Set via
external_labels.clusteron each Prometheus. - Useful when one datasource aggregates multiple clusters (Thanos / unified Prometheus).
- Ignored if you use a separate datasource per cluster.
- Set via
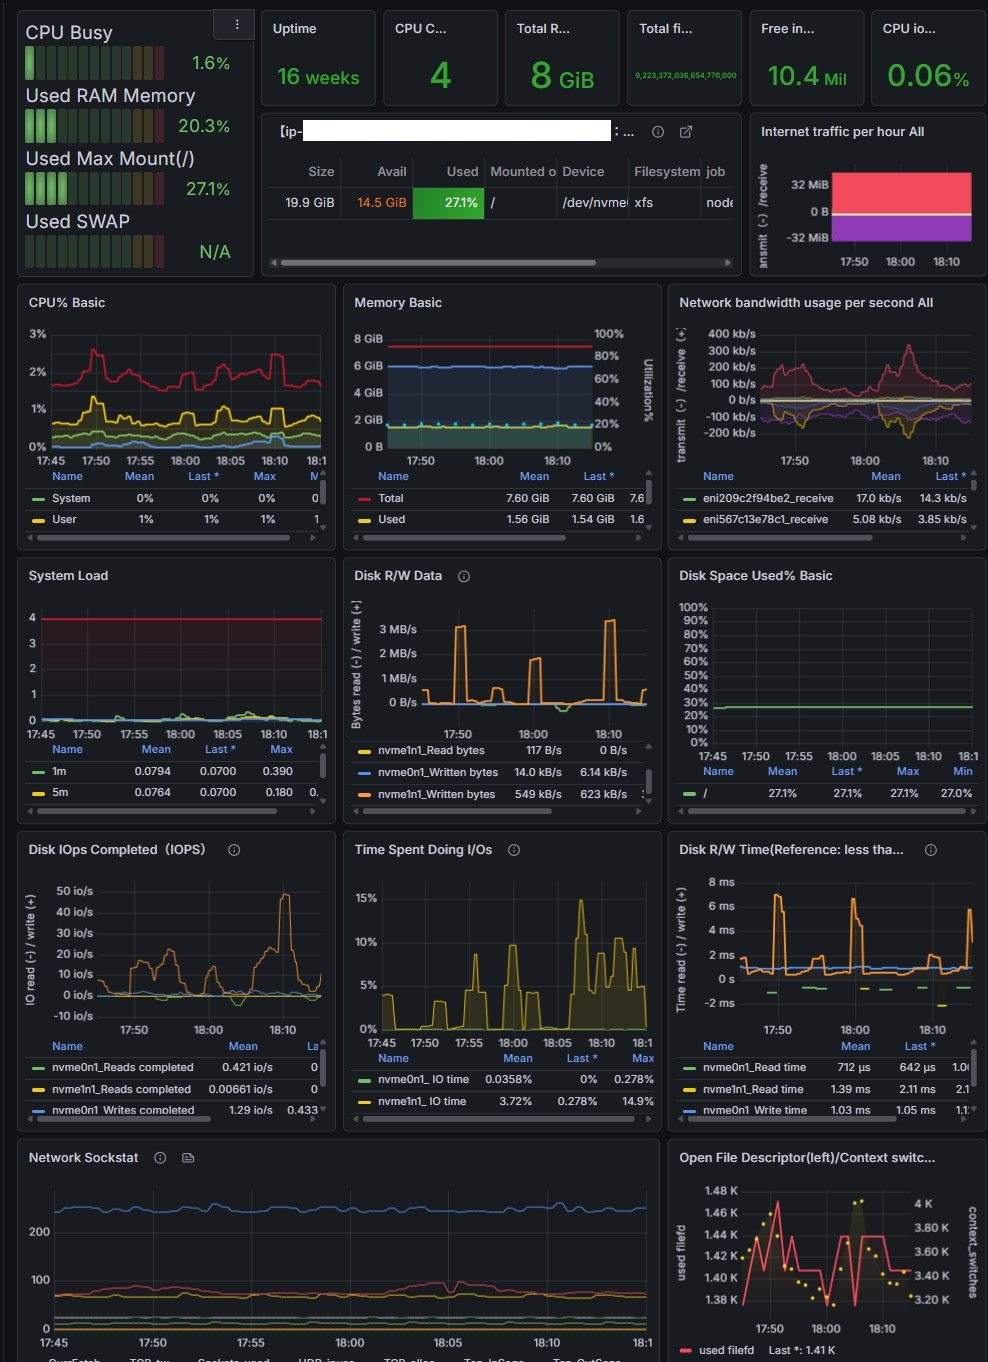
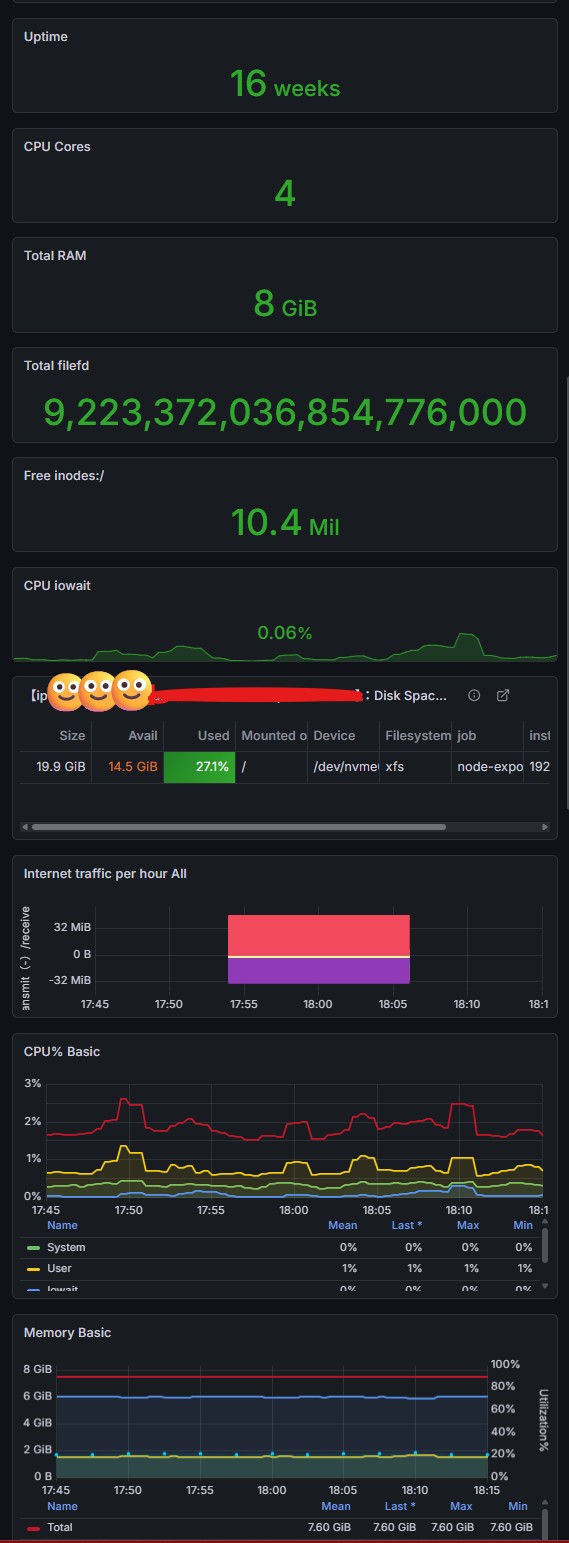
Job,Interval: standard scope filters.[Detail] Host / Instance / NIC: filters that affect only the Resource Details section.
Use case
- We operate multiple Kubernetes clusters, with node-exporter and prometheus deployed to each cluster via the kube-prometheus-stack helm chart.
- Goal: monitor metrics from multiple clusters in a centralized environment (1 dashboard, 1 Grafana).
Recommendation
- Kiosk mode is recommended for better readability.
Source
- Latest: https://github.com/YunanJeong/cmm
- Original (11074): https://grafana.com/grafana/dashboards/11074-node-exporter-for-prometheus-dashboard-en-v20201010/
- Reference repo: https://github.com/starsliao/Prometheus
Changelog
2026.06.
- Support Grafana 13 (2026)
- Support Dynamic Query: Datasource (Prometheus), Cluster, Job
- Renamed
origin_prometheus→cluster(variable name, label, and metric label all unified)
- Renamed
- Add Column Filter
2025
- Support Grafana 11.3
- Support Dynamic Selection for Multi-DataSource (Prometheus)
- Default settings of table
minWidthfor vertical mode - Modify the design of some panels: Total CPU / Total Memory / Total Disk
- Delete redirection links
- Link URL redirection is unstable in the latest Grafana. Use label selection instead.
- Note on 11074 base
- 11074's style is very useful, and its publisher supports other advanced dashboards (e.g. 16098)
- But they only support Chinese in the latest Grafana
Data source config
Collector type:
Collector plugins:
Collector config:
Revisions
Upload an updated version of an exported dashboard.json file from Grafana
| Revision | Description | Created | |
|---|---|---|---|
| Download |
Kubernetes
Monitor your Kubernetes deployment with prebuilt visualizations that allow you to drill down from a high-level cluster overview to pod-specific details in minutes.
Learn more