Redis Cluster
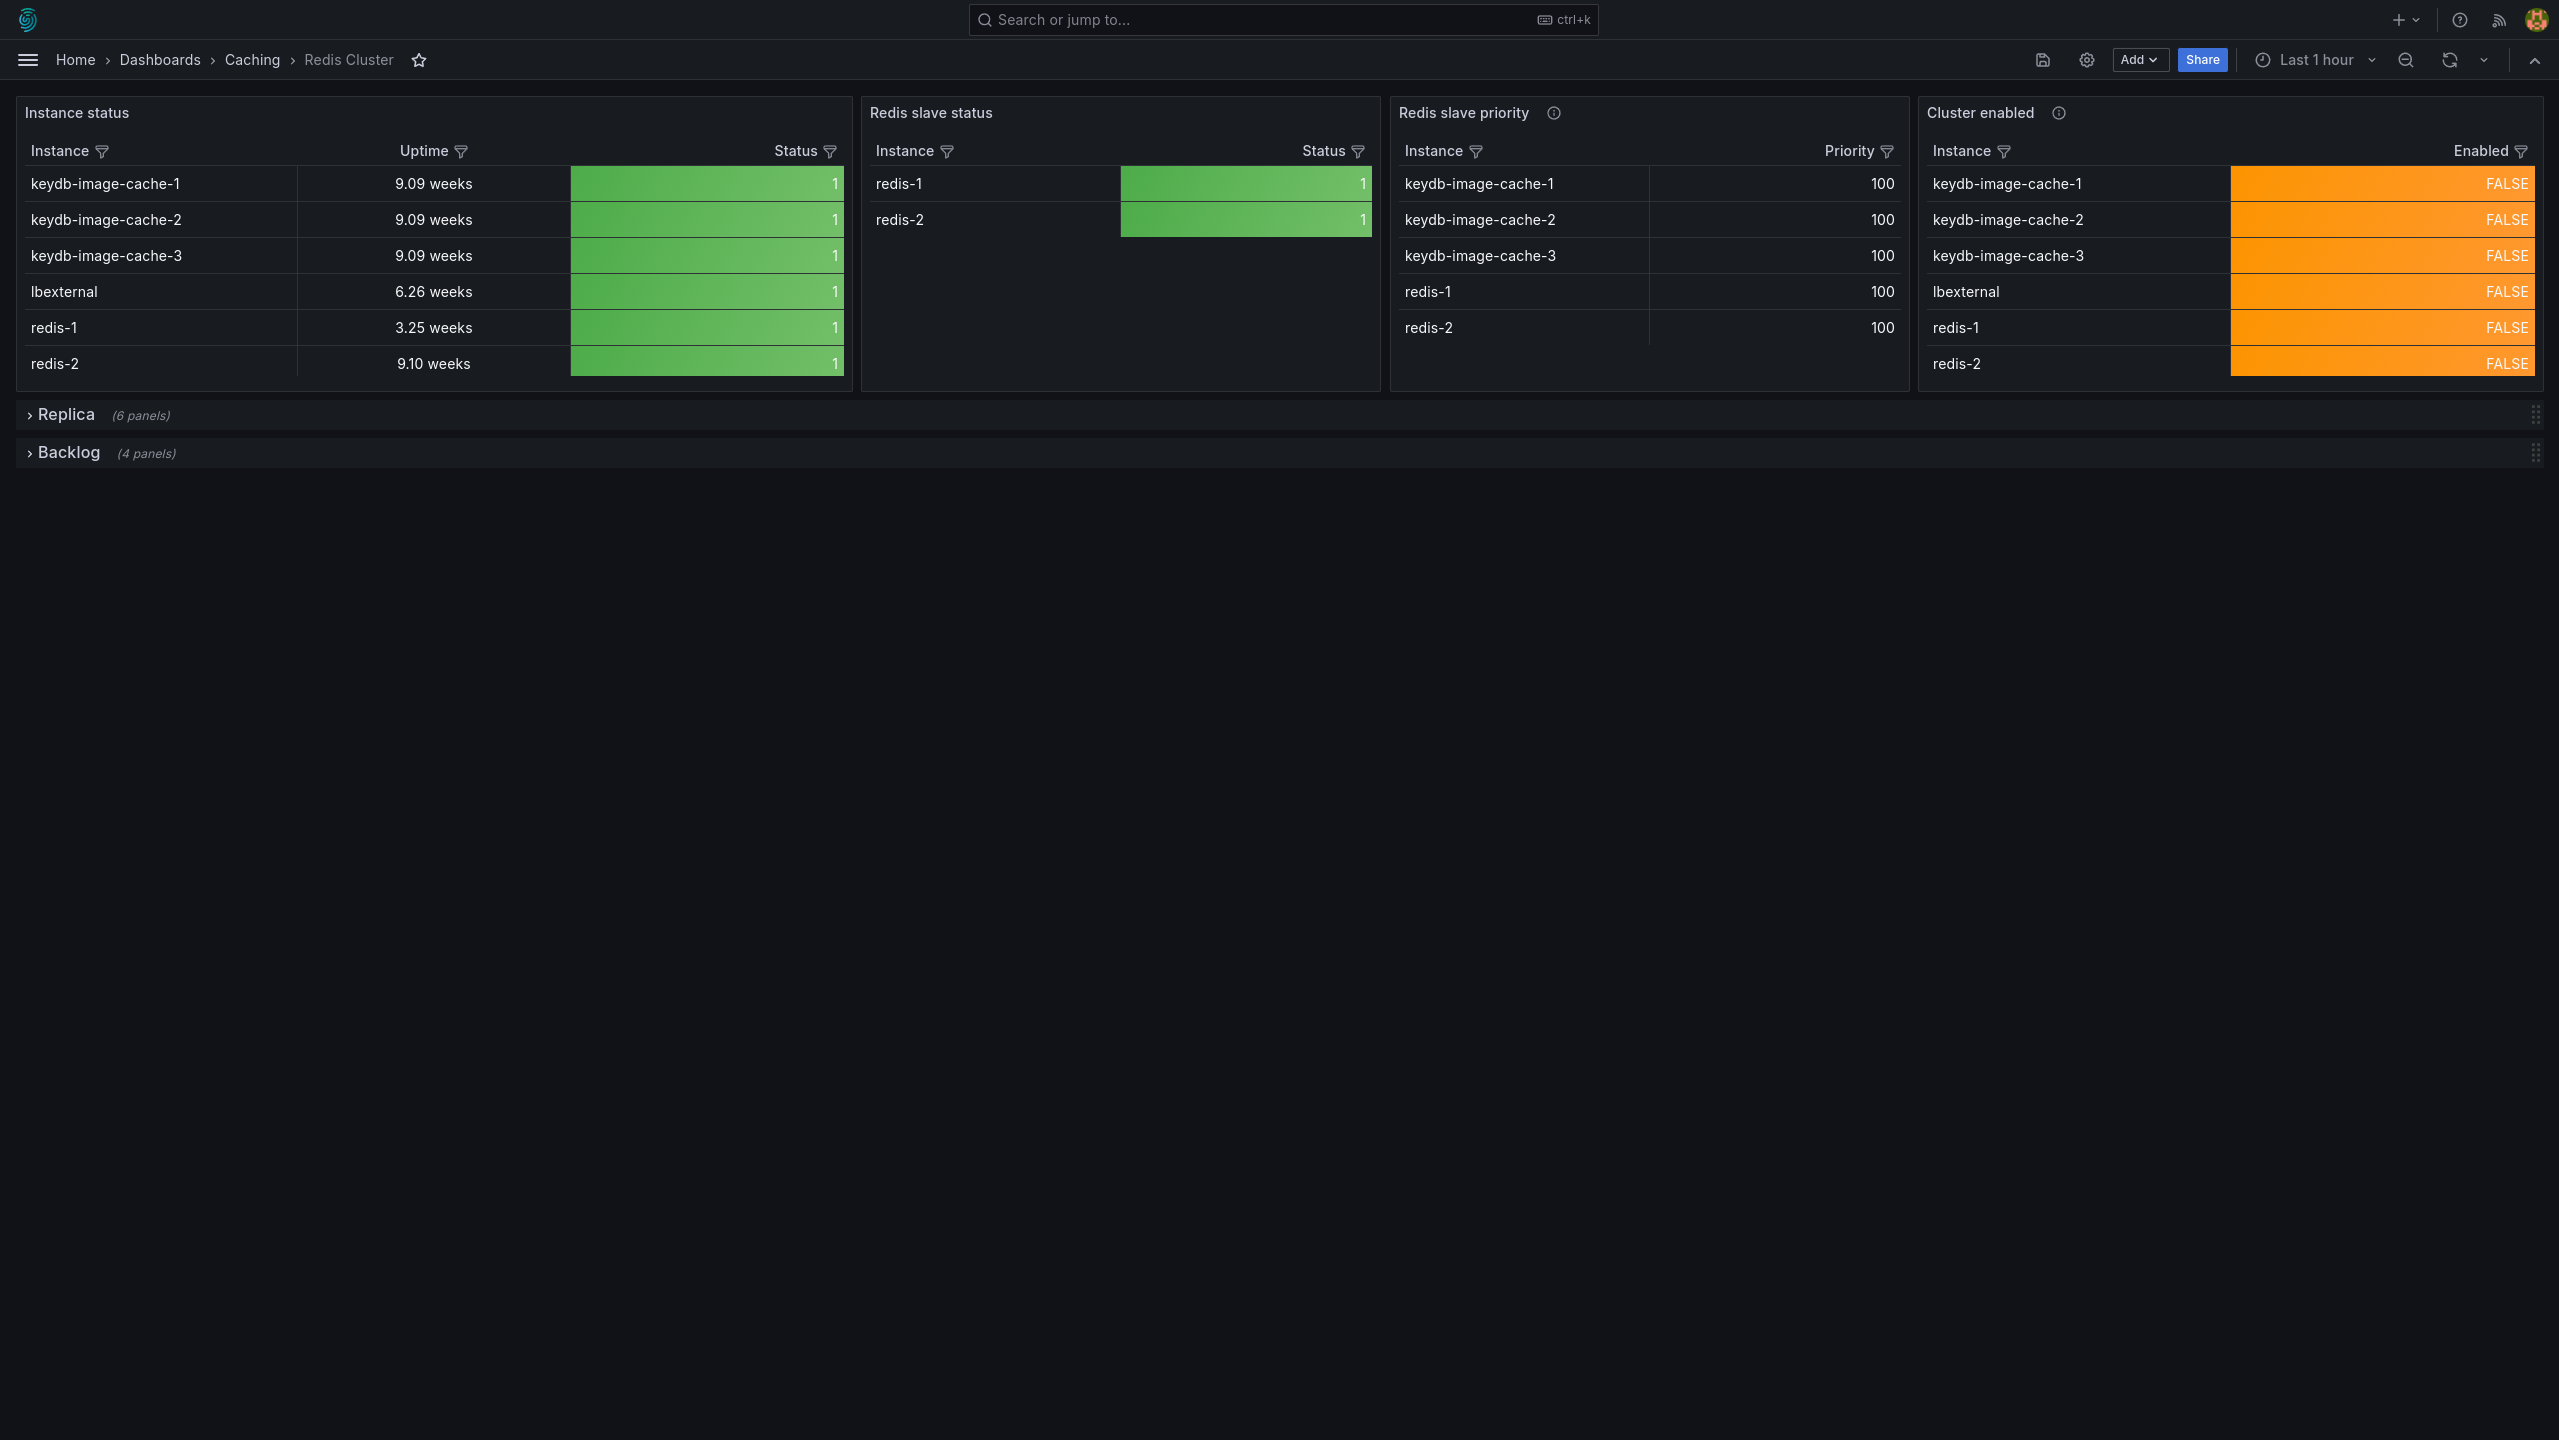
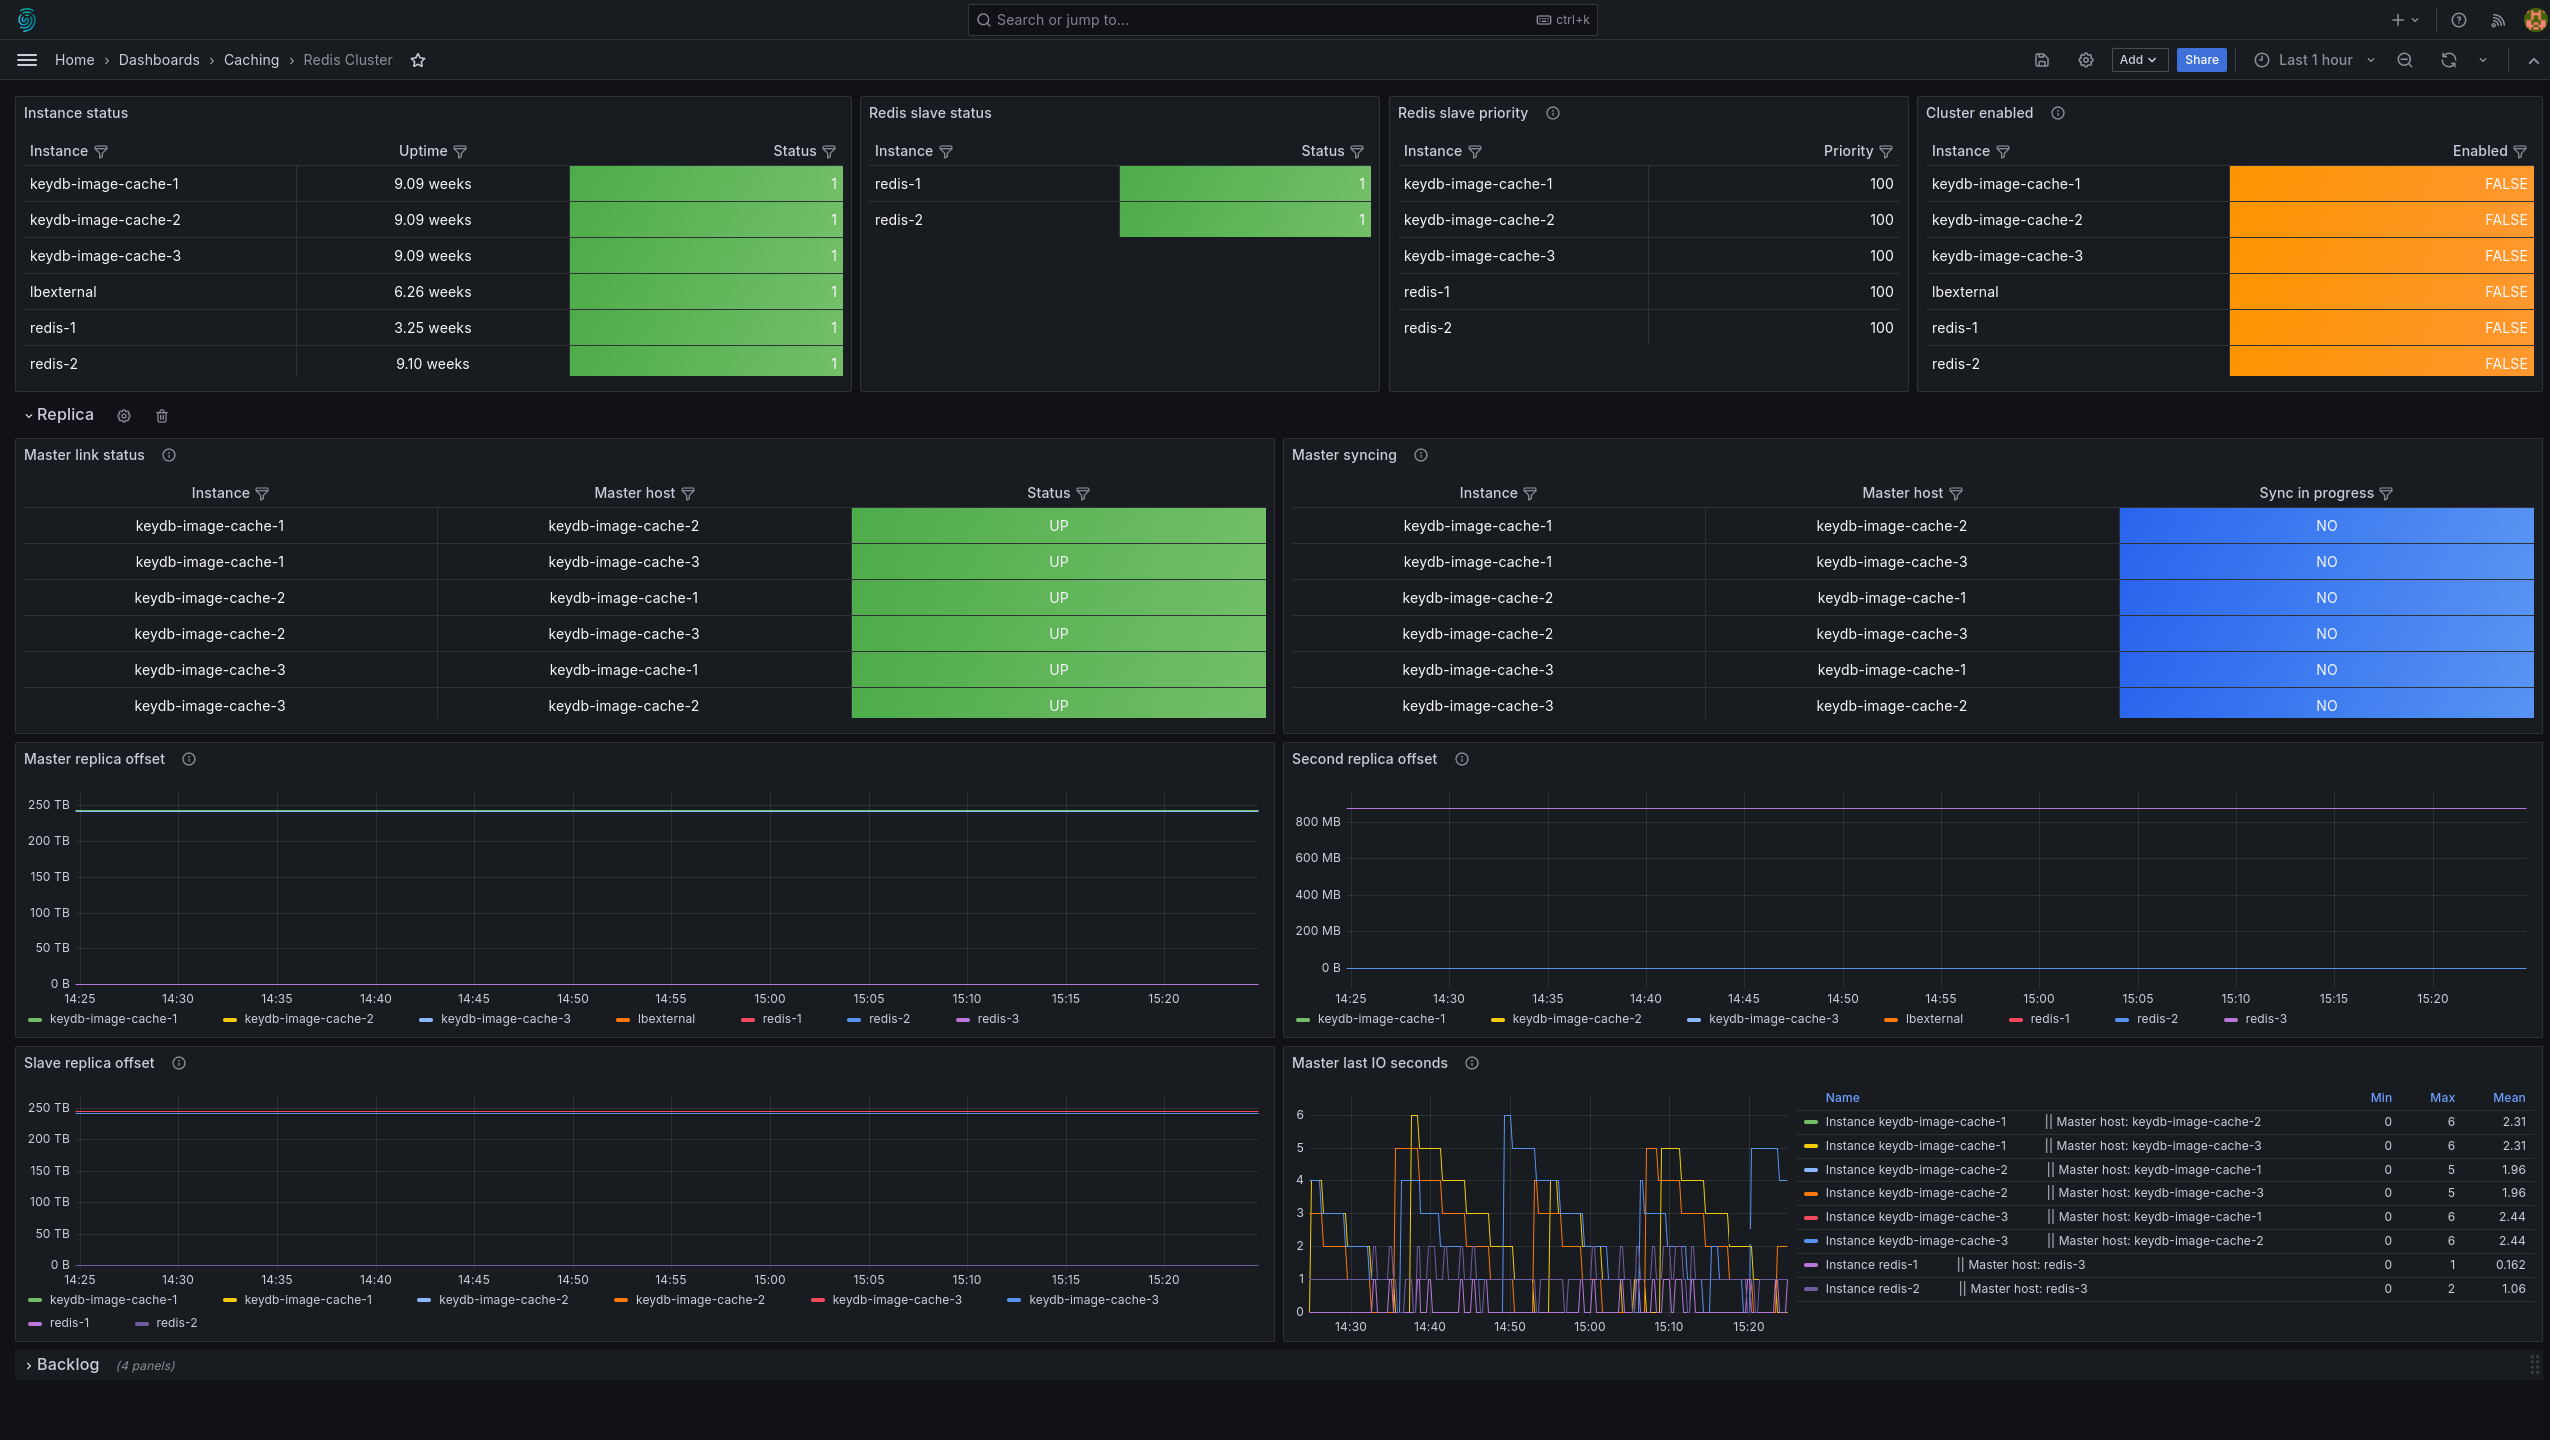
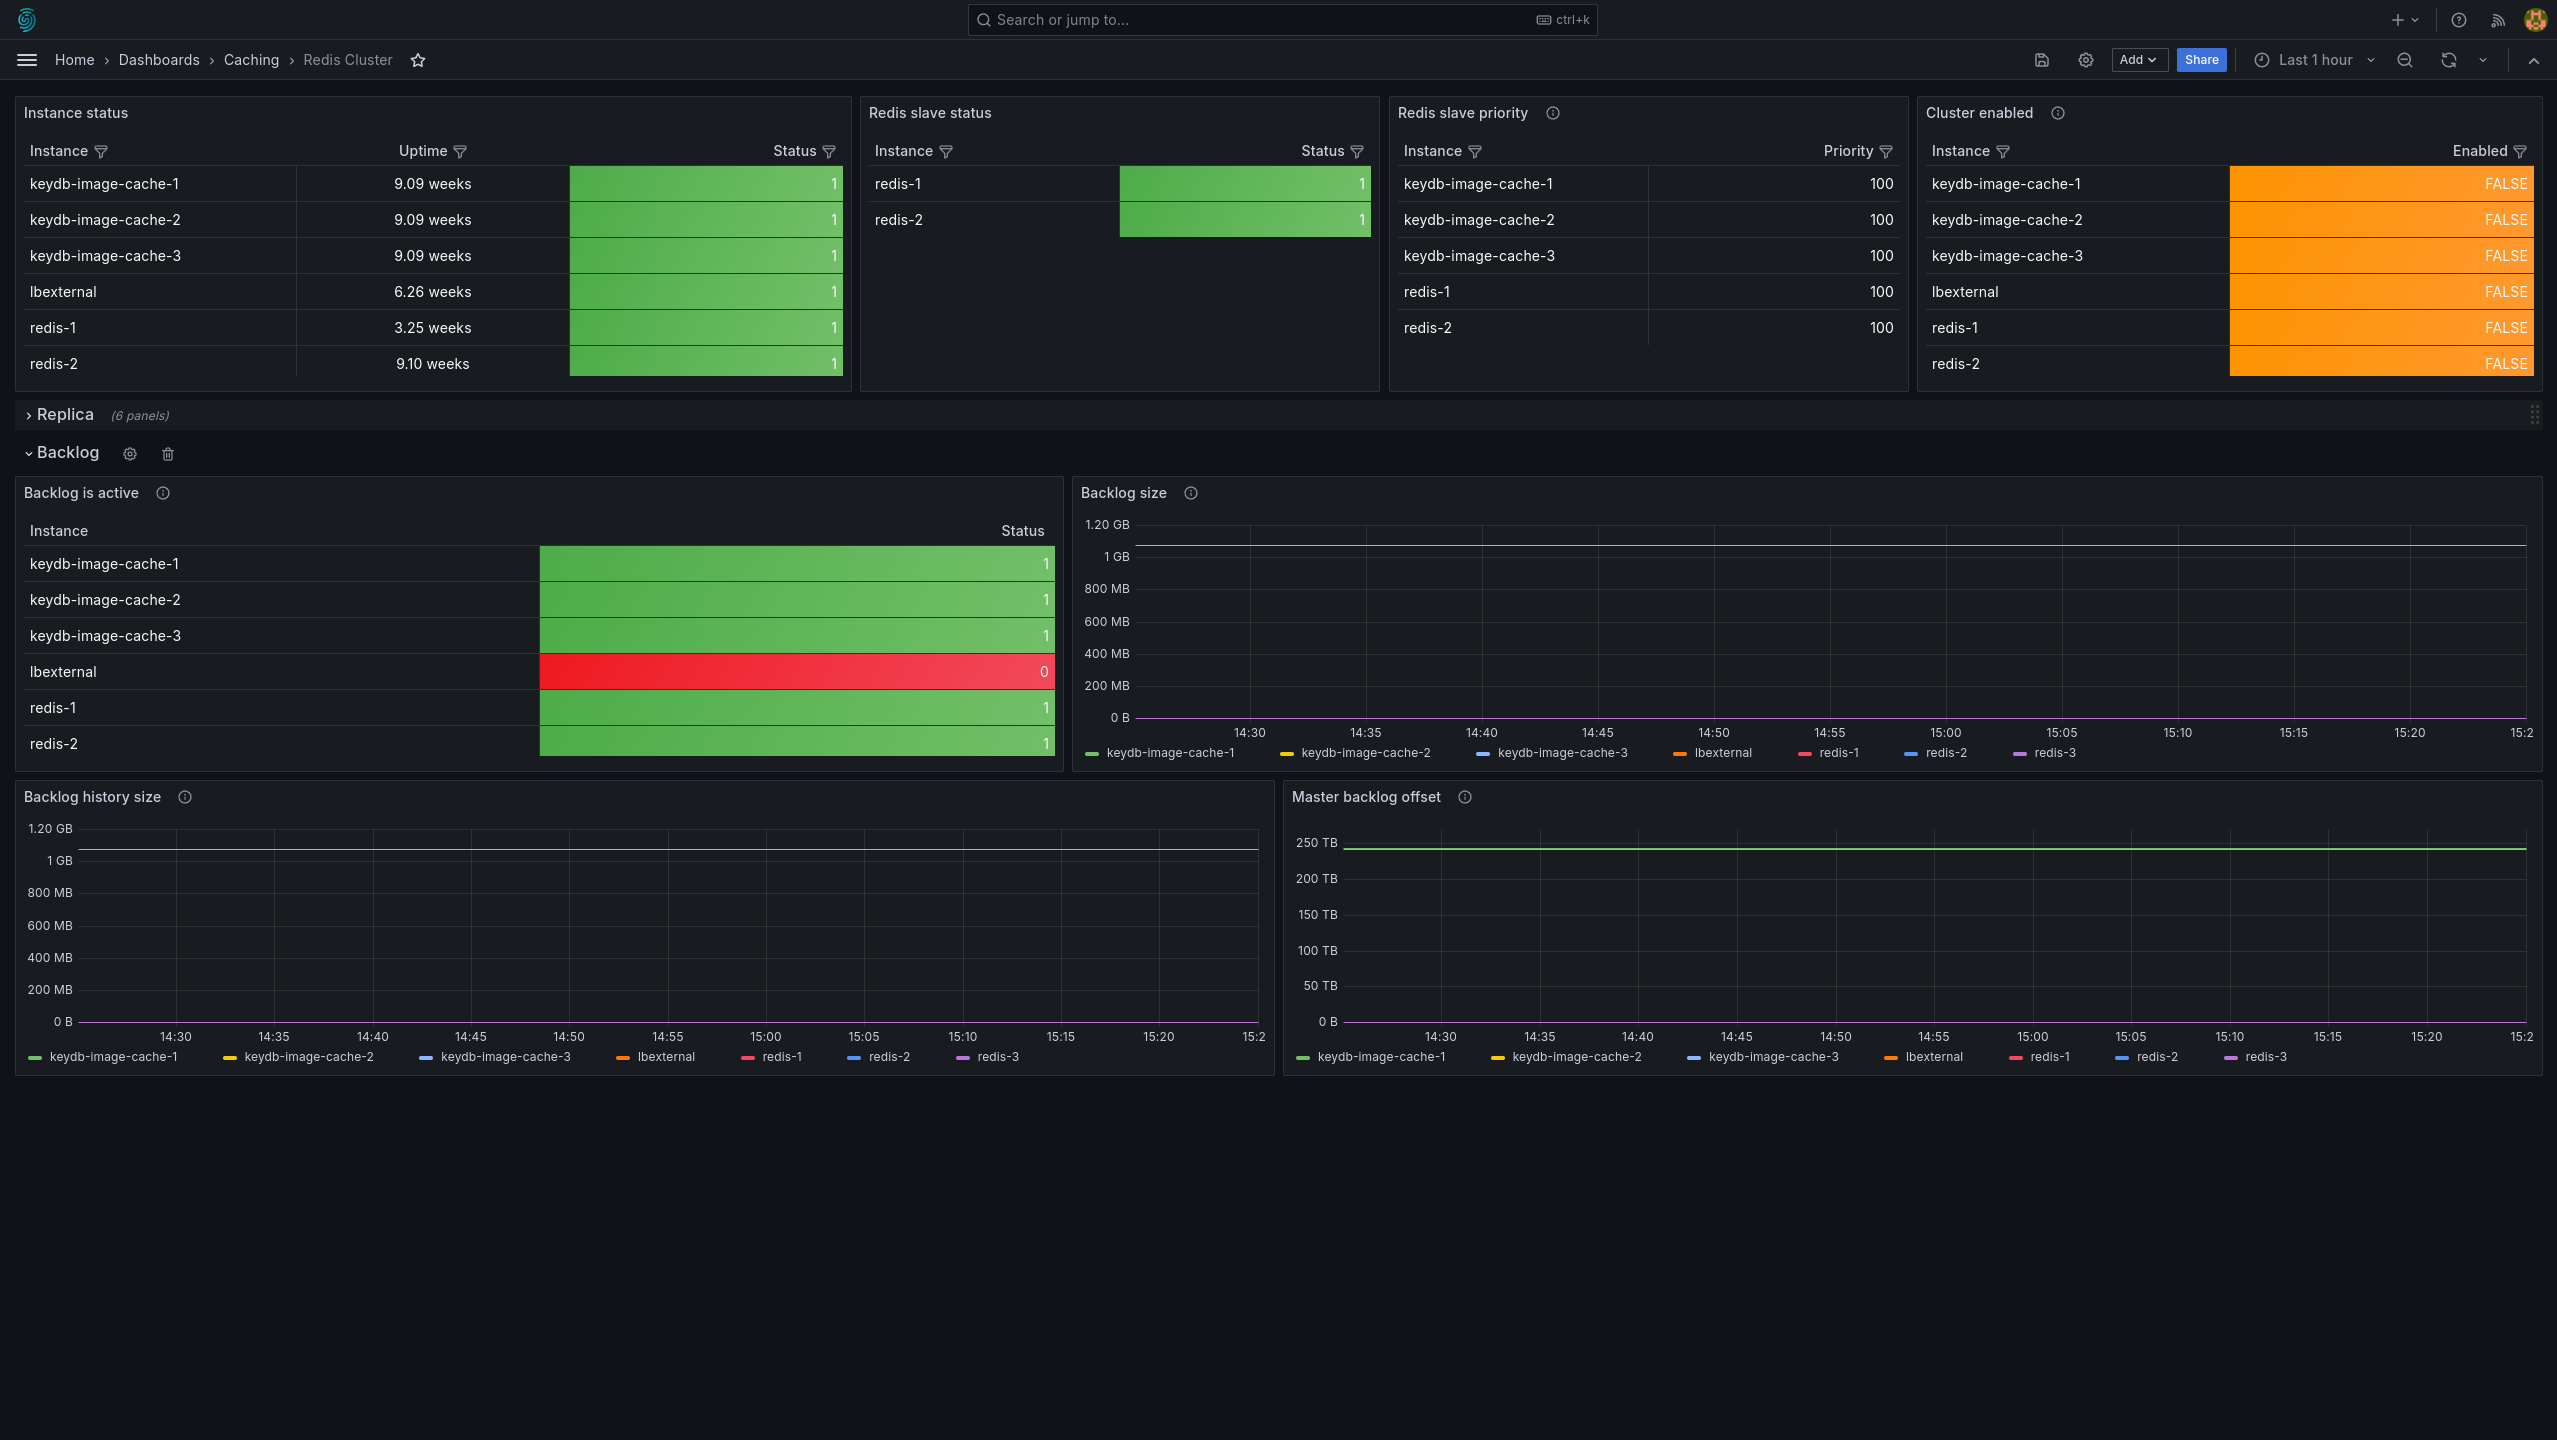
Dashboard is showing state and configuration for Redis cluster
Redis cluster dashboard 📈
This dashboard was made for scratch. Dashboard is showing state and configuration for Redis cluster. Metrics used are exported by Redis exporter.
Github repo 📂
https://github.com/jura43/grafana-dashboards/tree/main/redis-cluster-dashboard
Feedback ⭐
If you liked this dashboard consider leaving review or starring Github repo.
Data source config
Collector type:
Collector plugins:
Collector config:
Revisions
Upload an updated version of an exported dashboard.json file from Grafana
| Revision | Description | Created | |
|---|---|---|---|
| Download |
Redis
Monitor Redis with Grafana. Easily monitor your Redis deployment with Grafana Cloud's out-of-the-box monitoring solution.
Learn more