
Cluster / Global performance
This Grafana dashboard offers a detailed overview of Kubernetes cluster performance and resource usage. It features time series graphs that monitor various metrics, including the number of namespaces, running pods, RAM usage, CPU usage and other key Kubernetes resources such as services, endpoints, and deployments. The dashboard also tracks persistent volume usage both as a percentage and in gigabytes, providing insights into storage utilization. Additionally, it visualizes network usage, covering both bytes and packets per second for incoming and outgoing traffic.
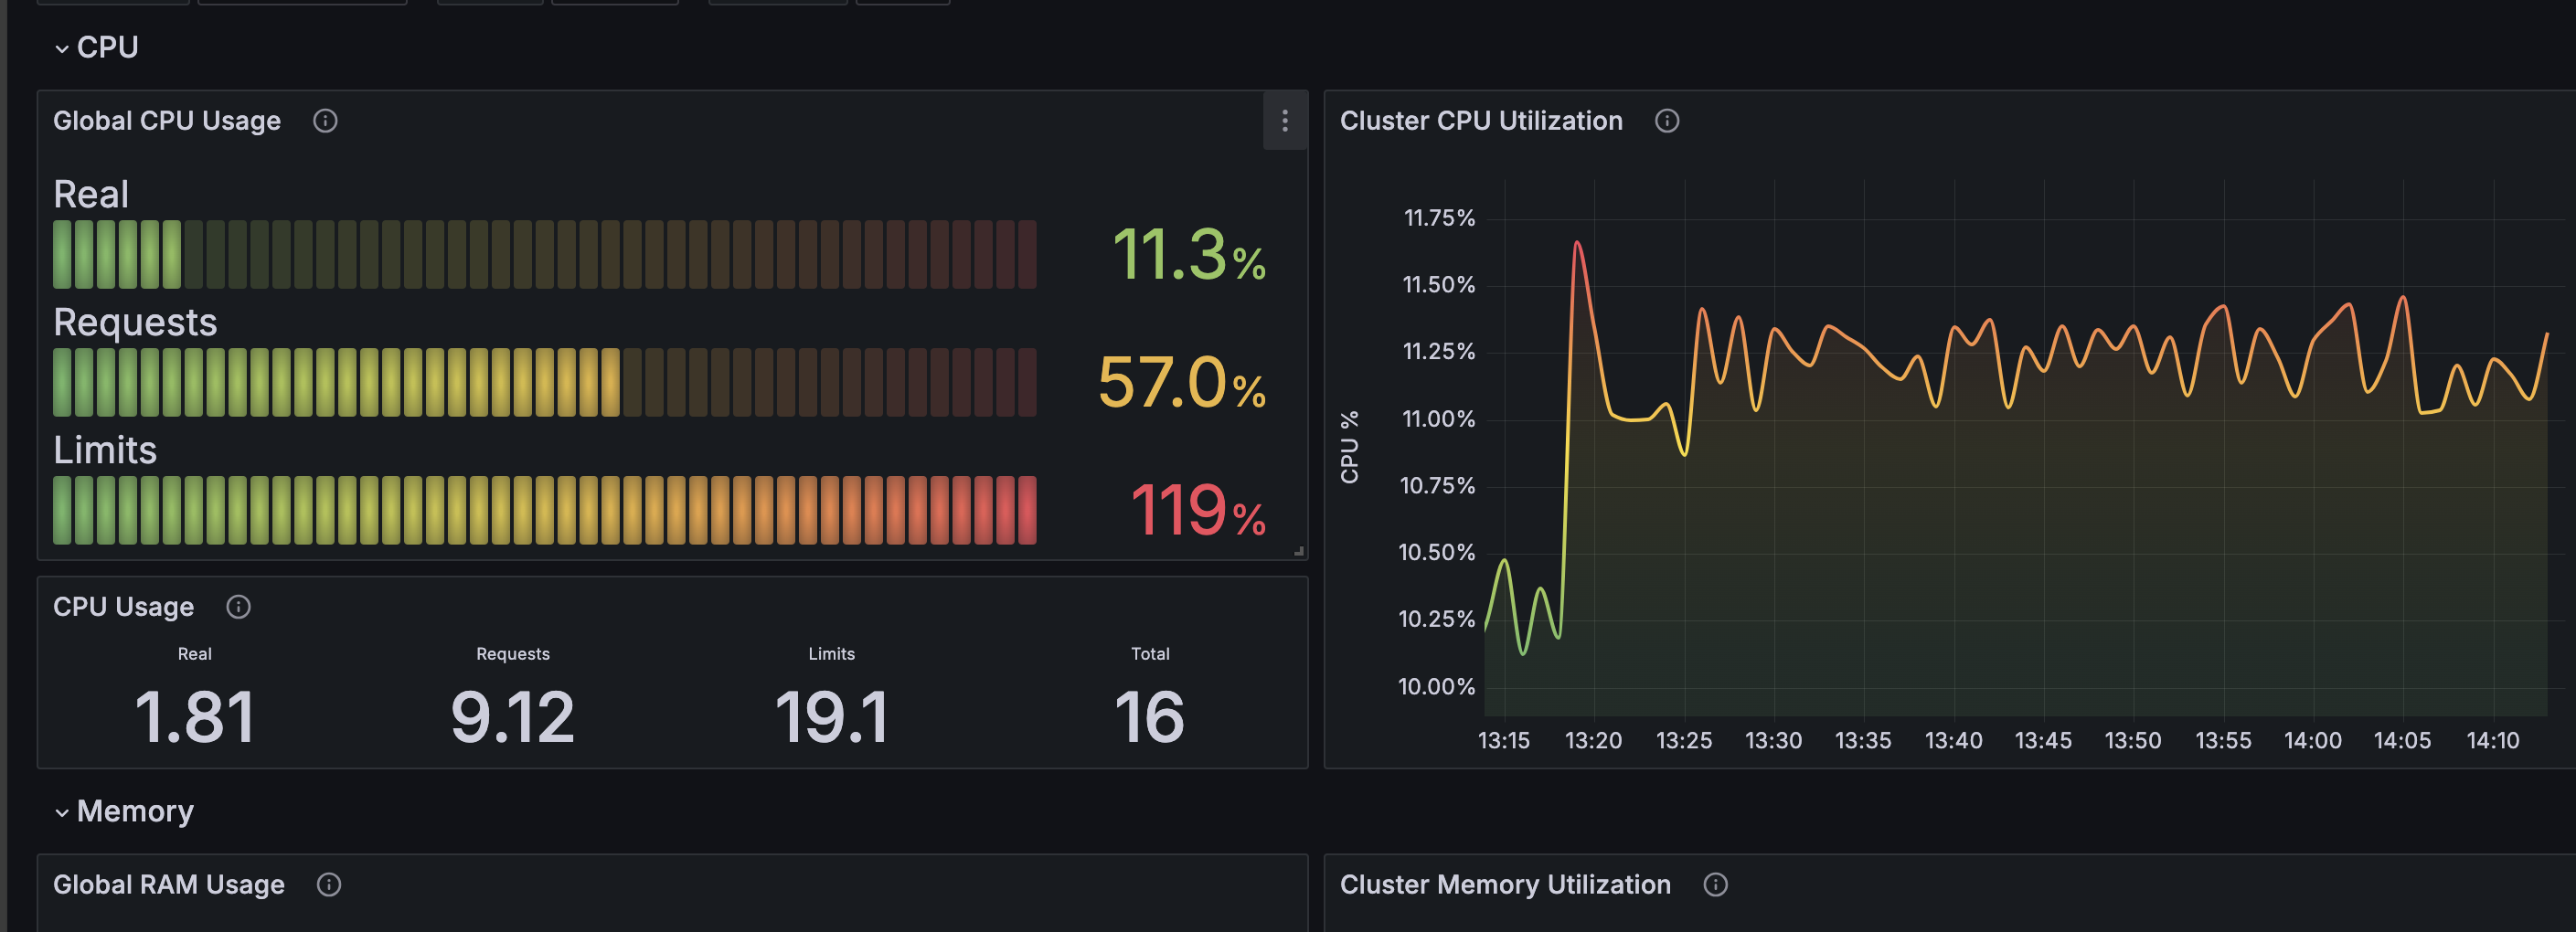
The Cluster / Global performance dashboard uses the prometheus data source to create a Grafana dashboard with the bargauge, stat, table and timeseries panels.
Data source config
Collector type:
Collector plugins:
Collector config:
Revisions
Upload an updated version of an exported dashboard.json file from Grafana
| Revision | Description | Created | |
|---|---|---|---|
| Download |