
APC SmartUPS Dashboard
Dashboard to display metrics relating to APC Smart-UPS devices. (grafana.com rev 5)

Overview
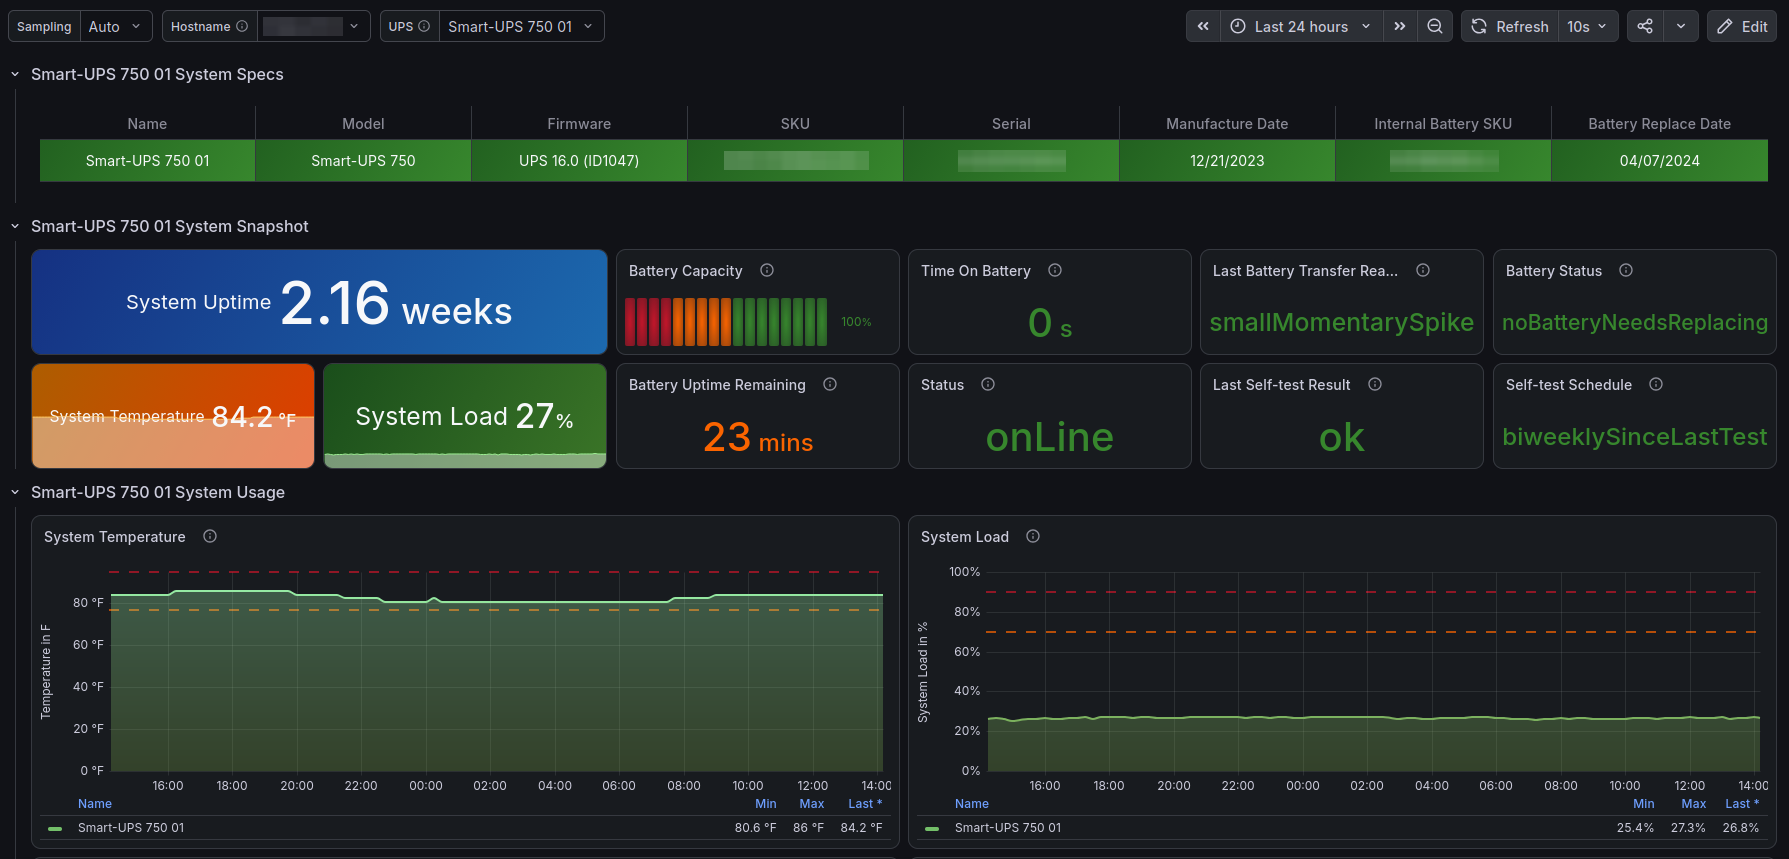
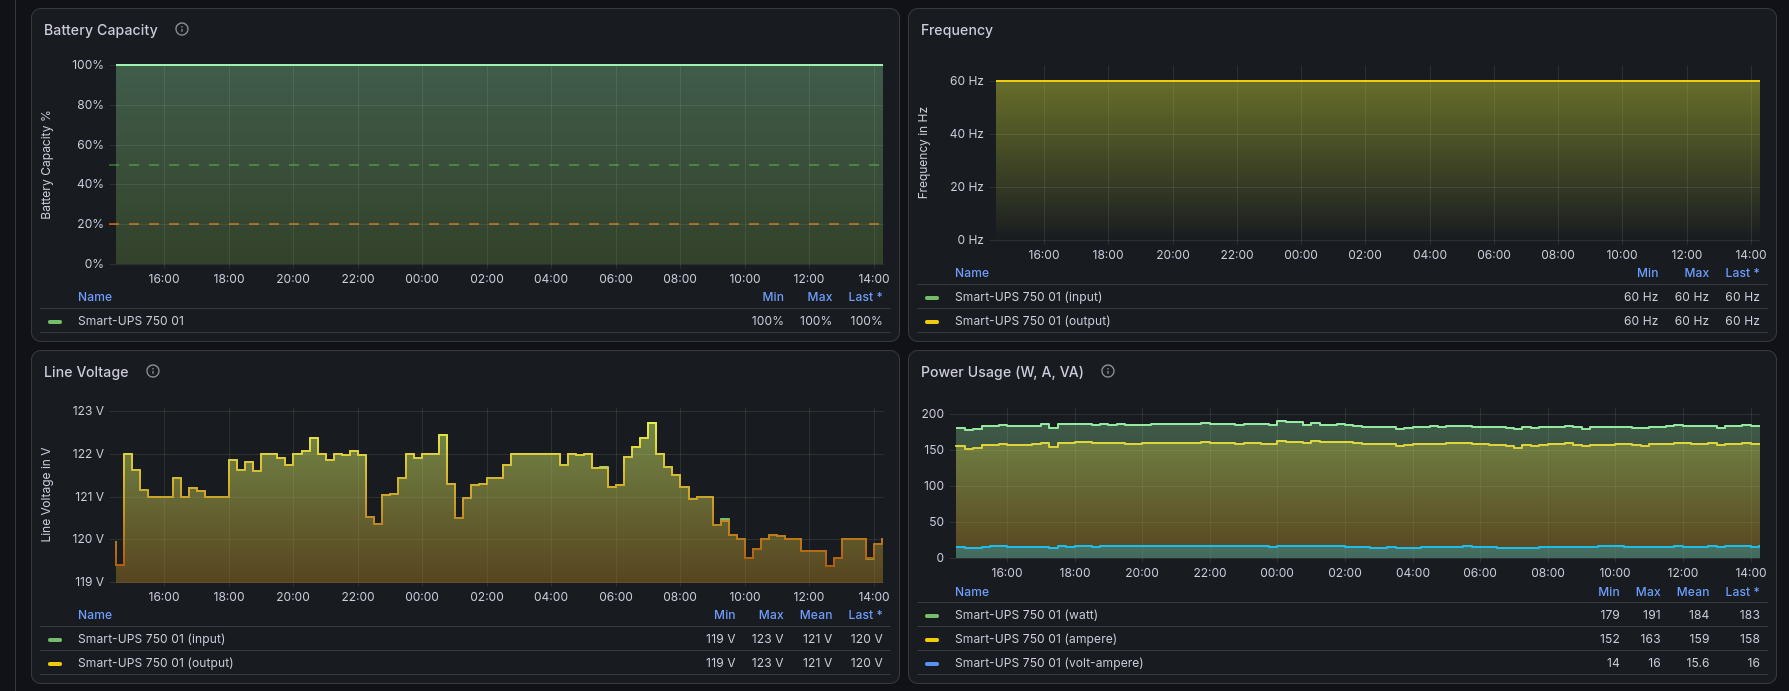
The APC SmartUPS dashboard visualizes the health and power status of APC Smart-UPS units — overall status, system load and temperature, battery capacity/runtime and time-on-battery, input/output line voltage and frequency, power draw (W / A / VA / kWh), and self-test schedule and results. Metrics are collected by Telegraf polling each UPS Network Management Card (NMC) over SNMP and written to InfluxDB v2, which Grafana queries with Flux. Multiple UPS units are supported via the UPS Hostname / UPS variables.
What's new in rev 5
- Set a stable, human-readable dashboard
uid. The dashboarduidchanged from the Grafana-generatedmleZBL2Gztoapc-smartups-dashboard, giving it a memorable URL (/d/apc-smartups-dashboard/...) that matches the repo filename. - No panel, metric, or query changes.
- Heads-up on re-import: because the
uidis the dashboard's identity, importing rev 5 creates a new dashboard rather than updating the old one. Delete the previous dashboard (old uidmleZBL2Gz) after importing, and update any saved links/bookmarks to the new URL.
What's new in rev 4
- Fixed the
UPSandUPS Hostnametemplate variables. In rev 3 their queries were serialized as character-indexed objects, which left the dropdowns empty on import. They are now correct Flux queries, so host/UPS selection works out of the box. - Refreshed the System Snapshot layout. Stat tiles are taller so the two-line labels stay readable, System Uptime is now a full-width highlighted tile above System Temperature / System Load, and the status tiles were widened to span two-thirds of the row.
- No metric or query changes — panels were only resized and repositioned. Existing users can re-import over the previous version.
Highlights
- System specs & status: Status, System Load, System Temperature, System Uptime, Self-test Schedule, Last Self-test Result, Last Battery Transfer Reason.
- Battery: Battery Status, Capacity, Bus Voltage, Uptime Remaining, Time On Battery.
- Power & line: Line Voltage, Frequency, Power Usage (W, A, VA), Power Usage (kWh), System Load.
- Multi-UPS ready via the
UPS Hostname/UPSvariables.
Requirements
- Grafana 11.1.3+
- InfluxDB v2 (queried with Flux) — pick your data source for the
DS_INFLUXDBinput on import. - Telegraf with the SNMP input polling an APC NMC 2 or 3. Provide the
PowerNet-MIBandRFC1213-MIBMIB files to Telegraf.
Variables
UPS Hostname, UPS, interval.
Data source config
Collector type:
Collector plugins:
Collector config:
Revisions
Upload an updated version of an exported dashboard.json file from Grafana
| Revision | Description | Created | |
|---|---|---|---|
| Download |