AWS ElastiCache Redis
Visualize AWS ElastiCache Redis metrics
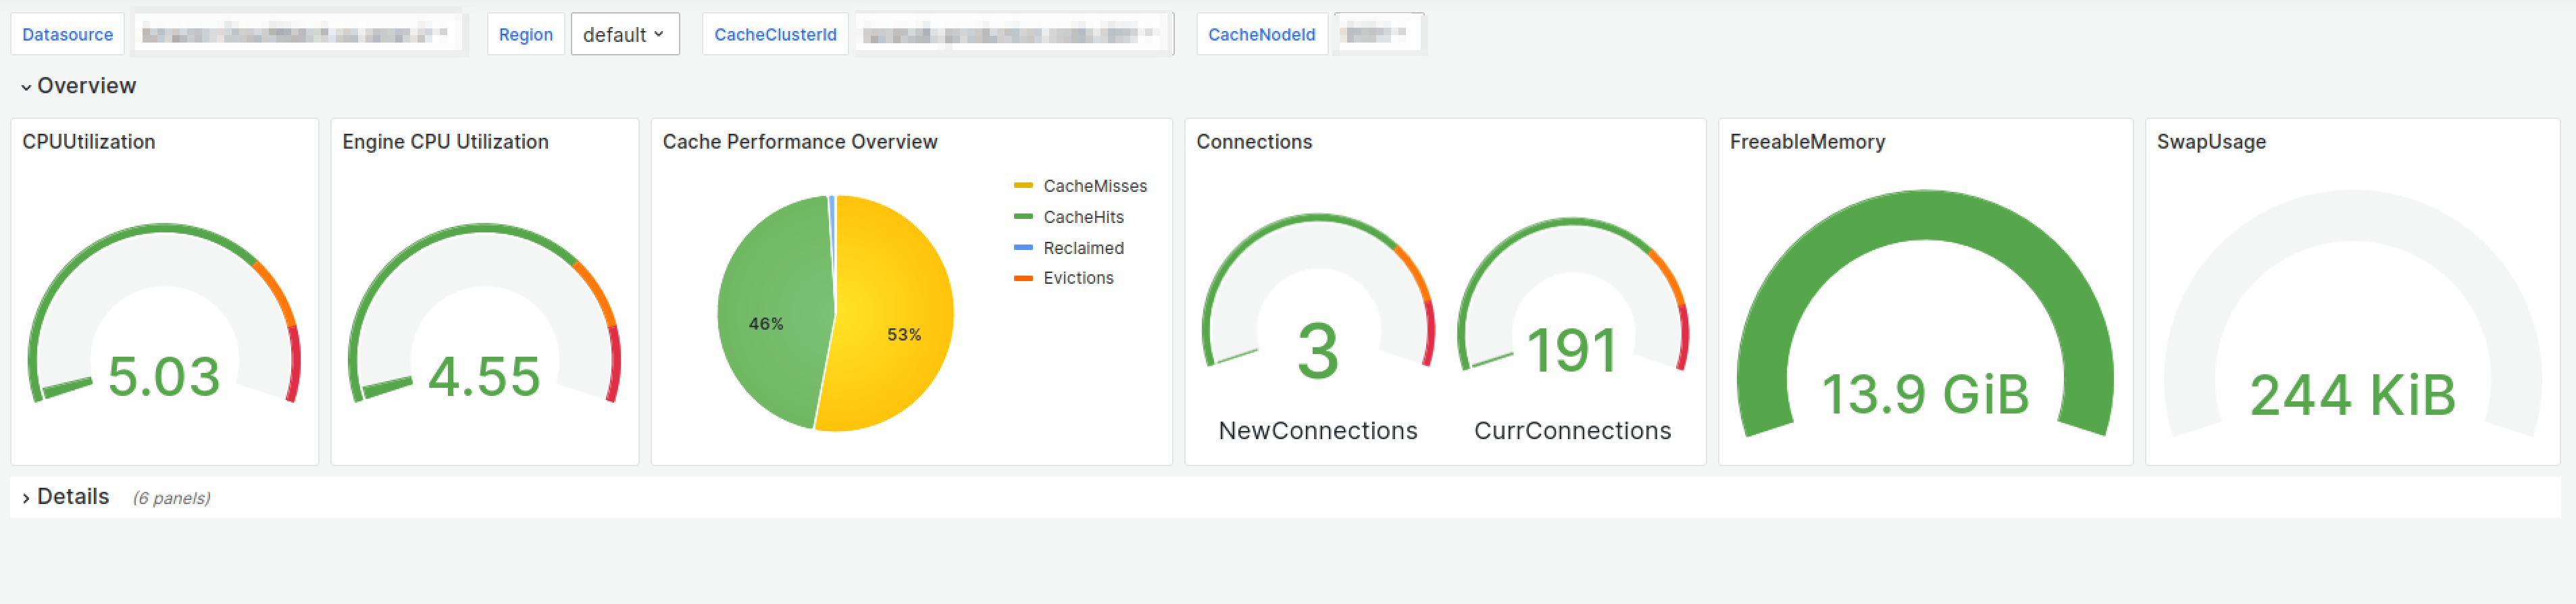
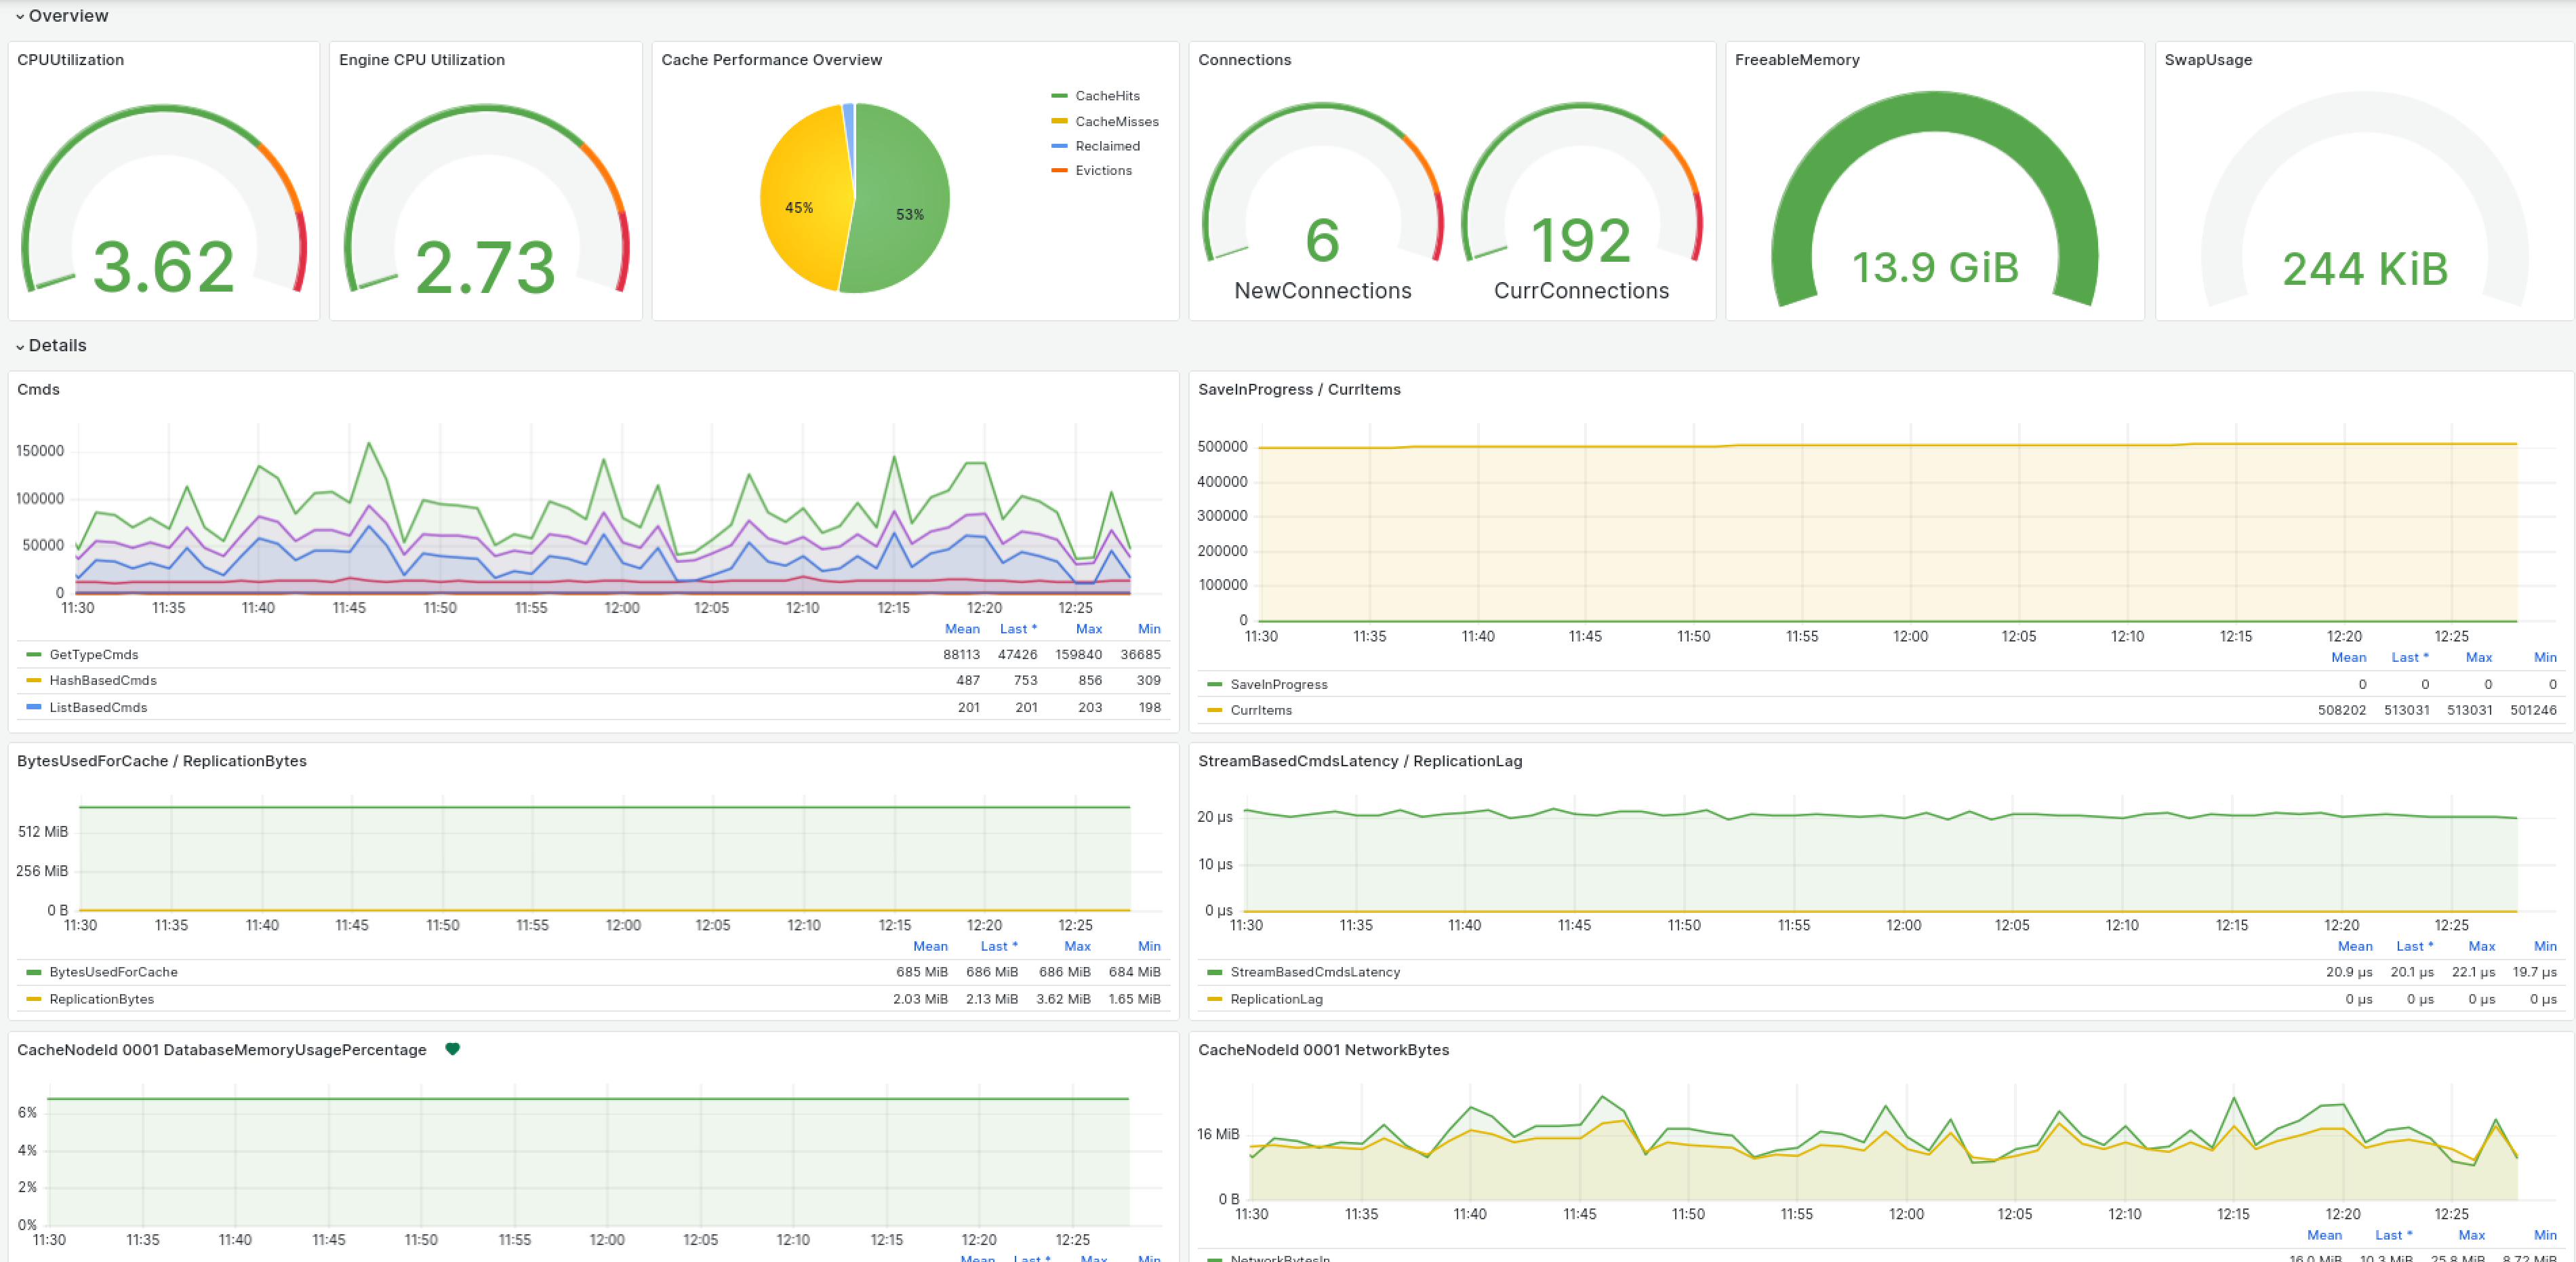
This performance monitoring dashboard is designed to provide real-time insights into system performance metrics, such as CPU utilization, cache performance, memory usage, and more. The dashboard is equipped with various visualizations to help users understand and analyze the system's behavior efficiently.
Data source config
Collector type:
Collector plugins:
Collector config:
Revisions
Upload an updated version of an exported dashboard.json file from Grafana
| Revision | Description | Created | |
|---|---|---|---|
| Download |
AWS
Easily visualize and alert on more than 60 Amazon Web Services (AWS) resources using the fully managed Grafana Cloud platform.
Learn more