OpenTelemetry for HTTP services
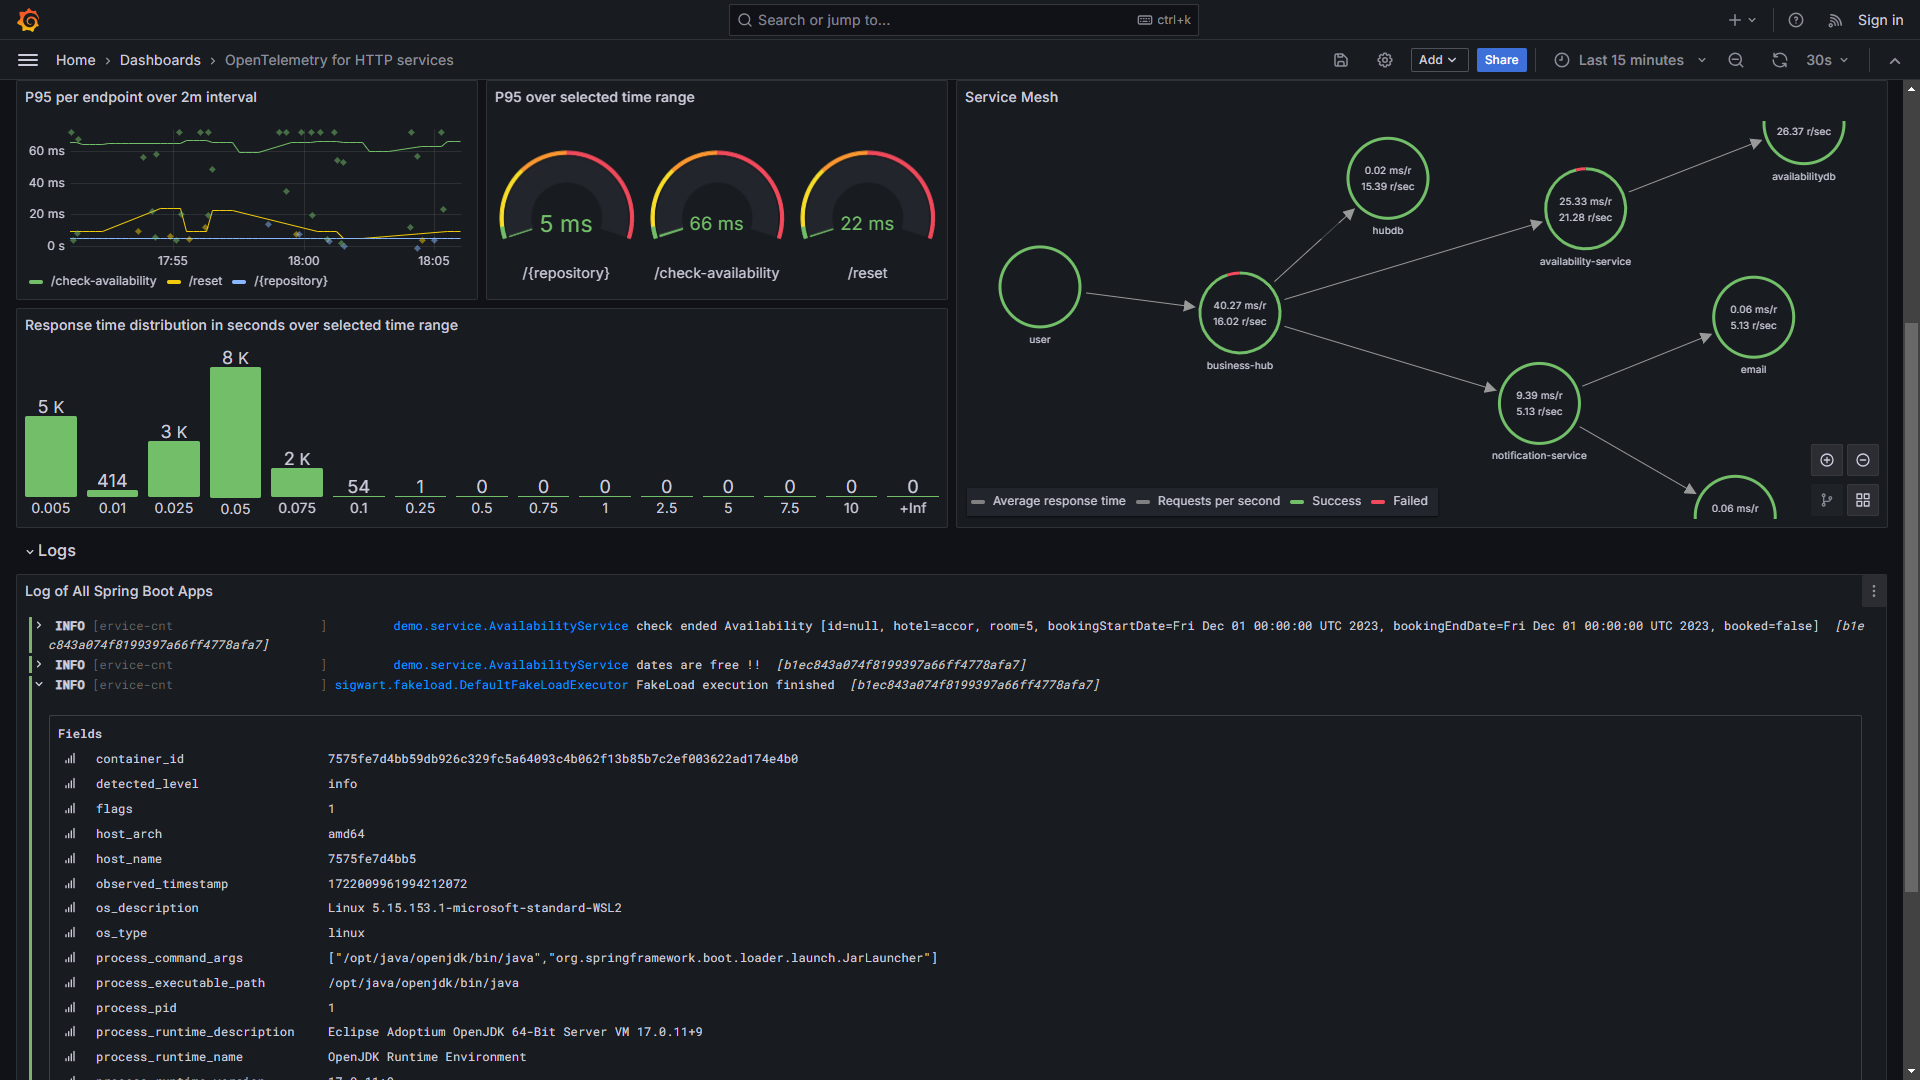
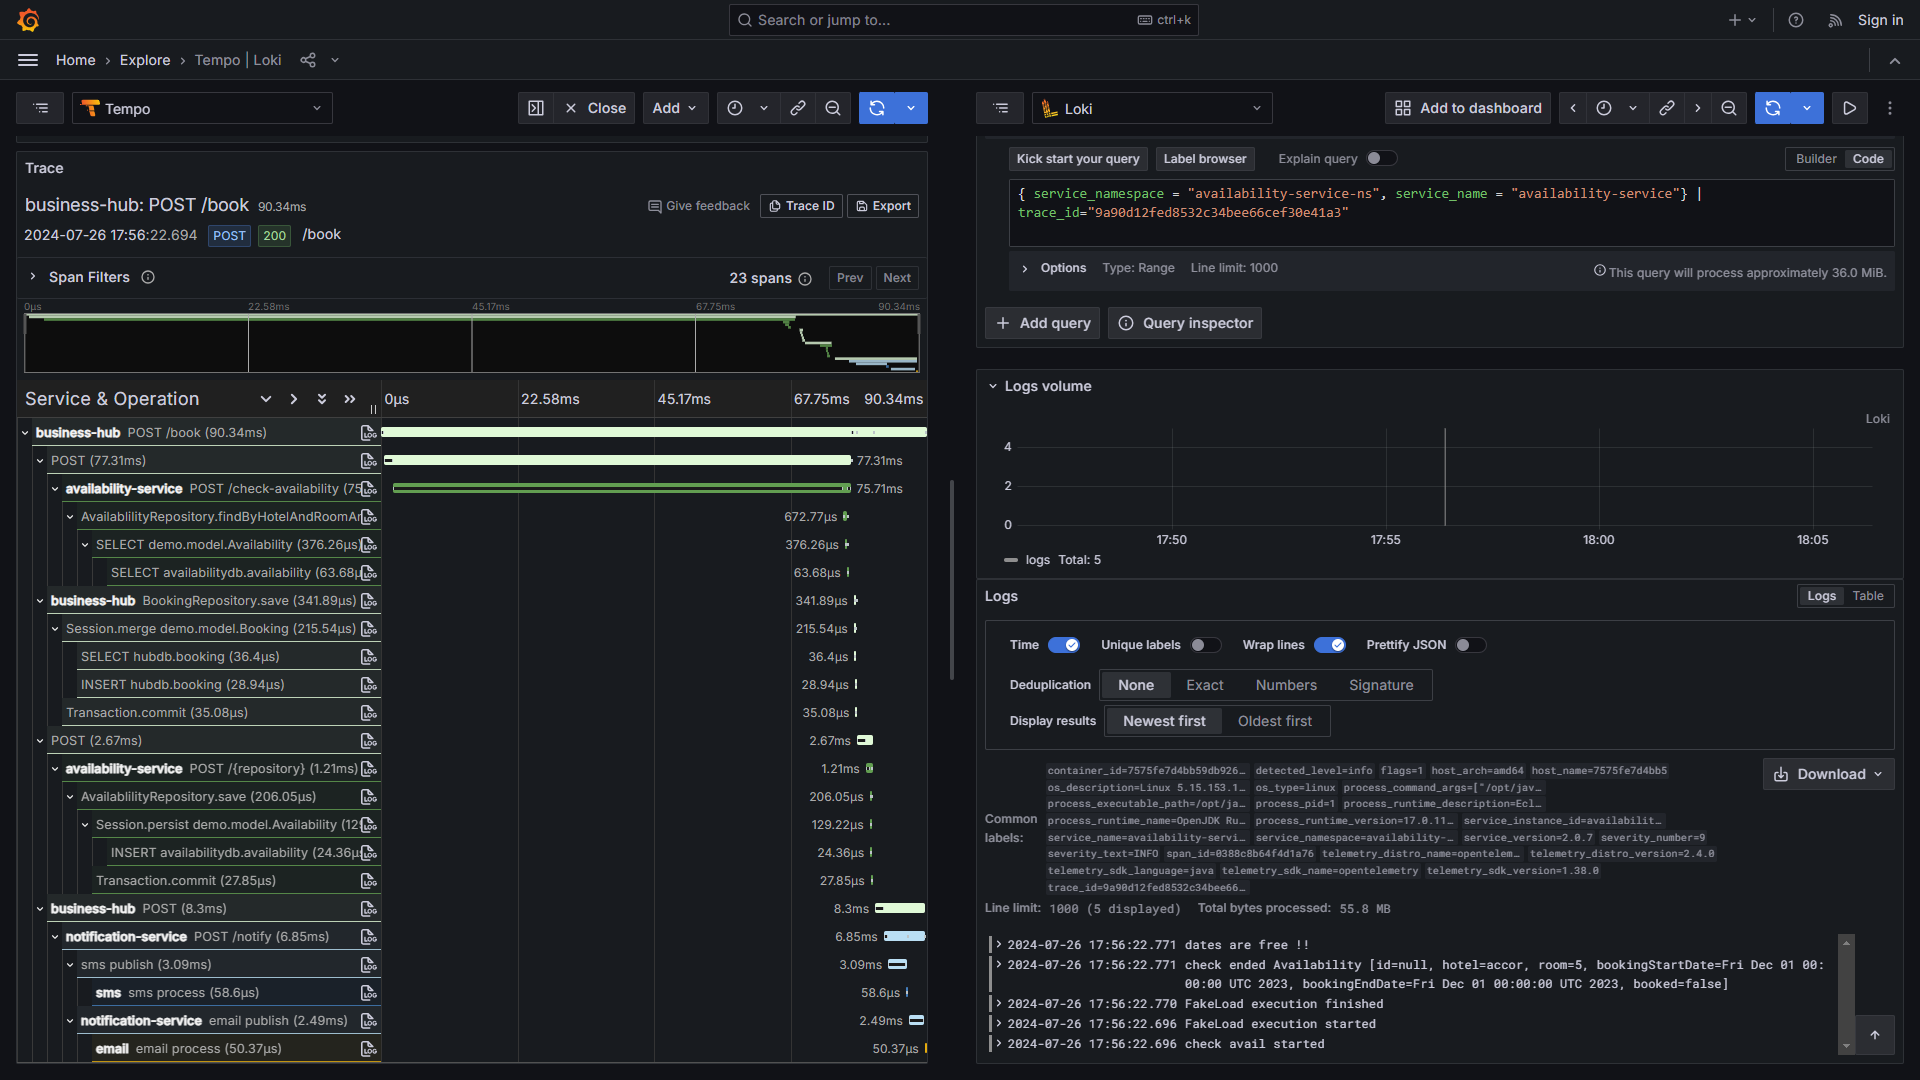
The OpenTelemetry for HTTP services dashboard uses the loki, prometheus and tempo data sources to create a Grafana dashboard with the bargauge, gauge, logs, nodeGraph, table and timeseries panels.
Data source config
Collector type:
Collector plugins:
Collector config:
Revisions
Upload an updated version of an exported dashboard.json file from Grafana
| Revision | Description | Created | |
|---|---|---|---|
| Download |
Apache HTTP Server
Easily monitor Apache HTTP Server, an open source HTTP server for modern operating systems including UNIX and Windows, with Grafana Cloud's out-of-the-box monitoring solution.
Learn more