Docker Swarm Overview
This dashboard provides general information about the status of the swarm cluster. Prometheus is used as a source. Metrics should be collected using docker native exporter. To enable docker native exporter, add the following parameter to the daemon.json config: { "metrics-addr": "0.0.0.0:9323" }
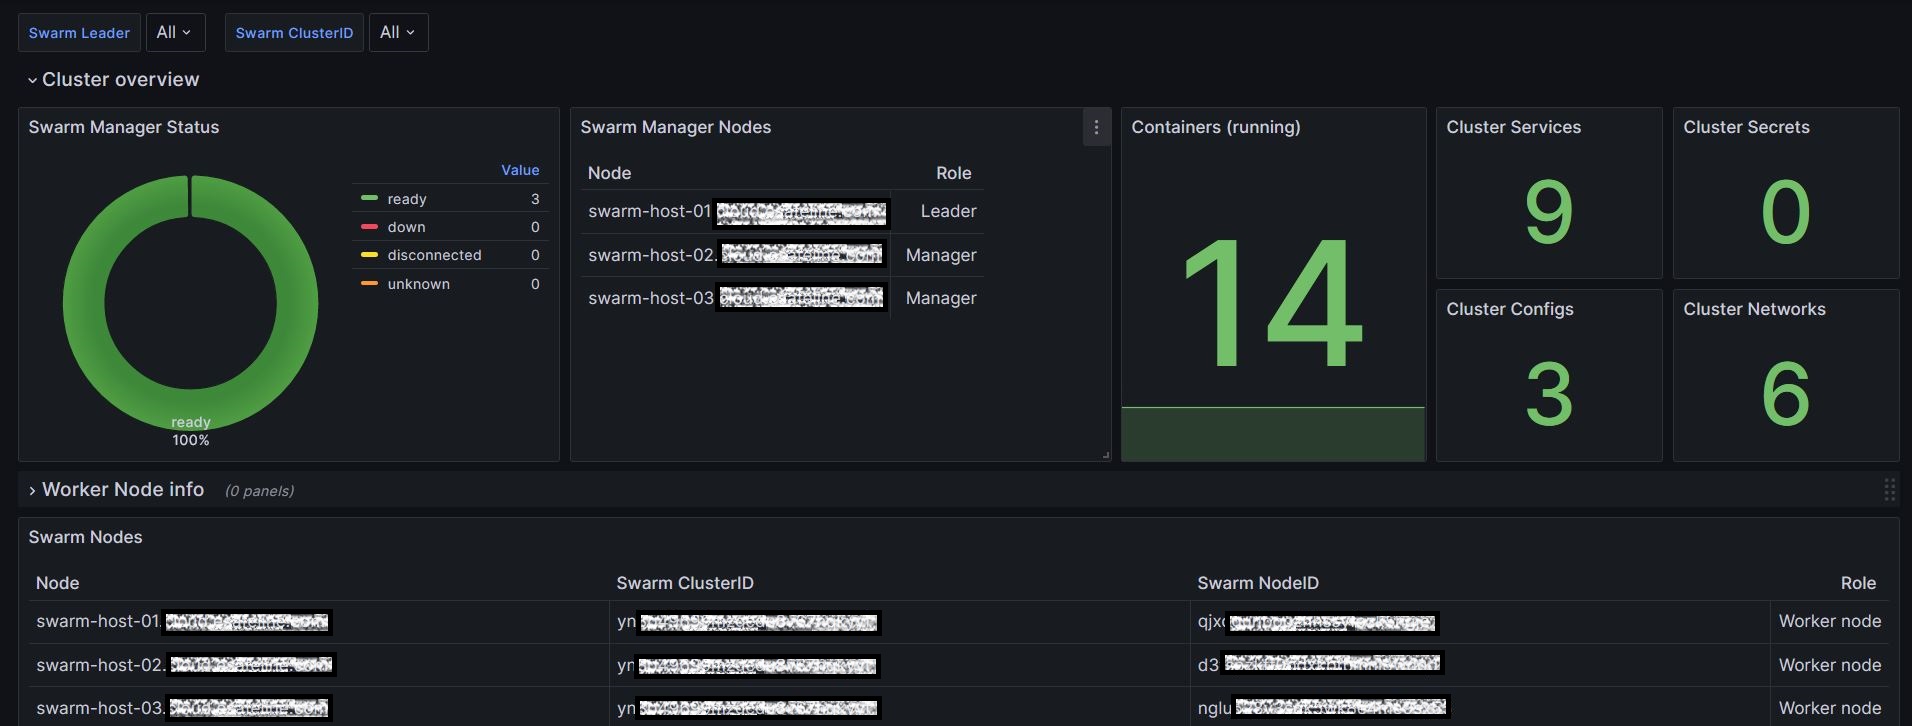
To enable docker native exporter, add the following parameter to the daemon.json config: { "metrics-addr": "0.0.0.0:9323" }
Data source config
Collector type:
Collector plugins:
Collector config:
Revisions
Upload an updated version of an exported dashboard.json file from Grafana
| Revision | Description | Created | |
|---|---|---|---|
| Download |
Docker
Easily monitor Docker with Grafana Cloud's out-of-the-box monitoring solution.
Learn more