
Contour Ingress Metrics
This Grafana dashboard comprehensively monitors the Project Contour Ingress Controller at the service and namespace level
Contour Ingress Metrics Dashboard
Overview
This Grafana dashboard comprehensively monitors the Project Contour Ingress Controller at the service level, offering a detailed view of various service-level statistics. The dashboard is designed to help you understand the performance, availability, and overall health of your ingress resources.
Dashboard Sections
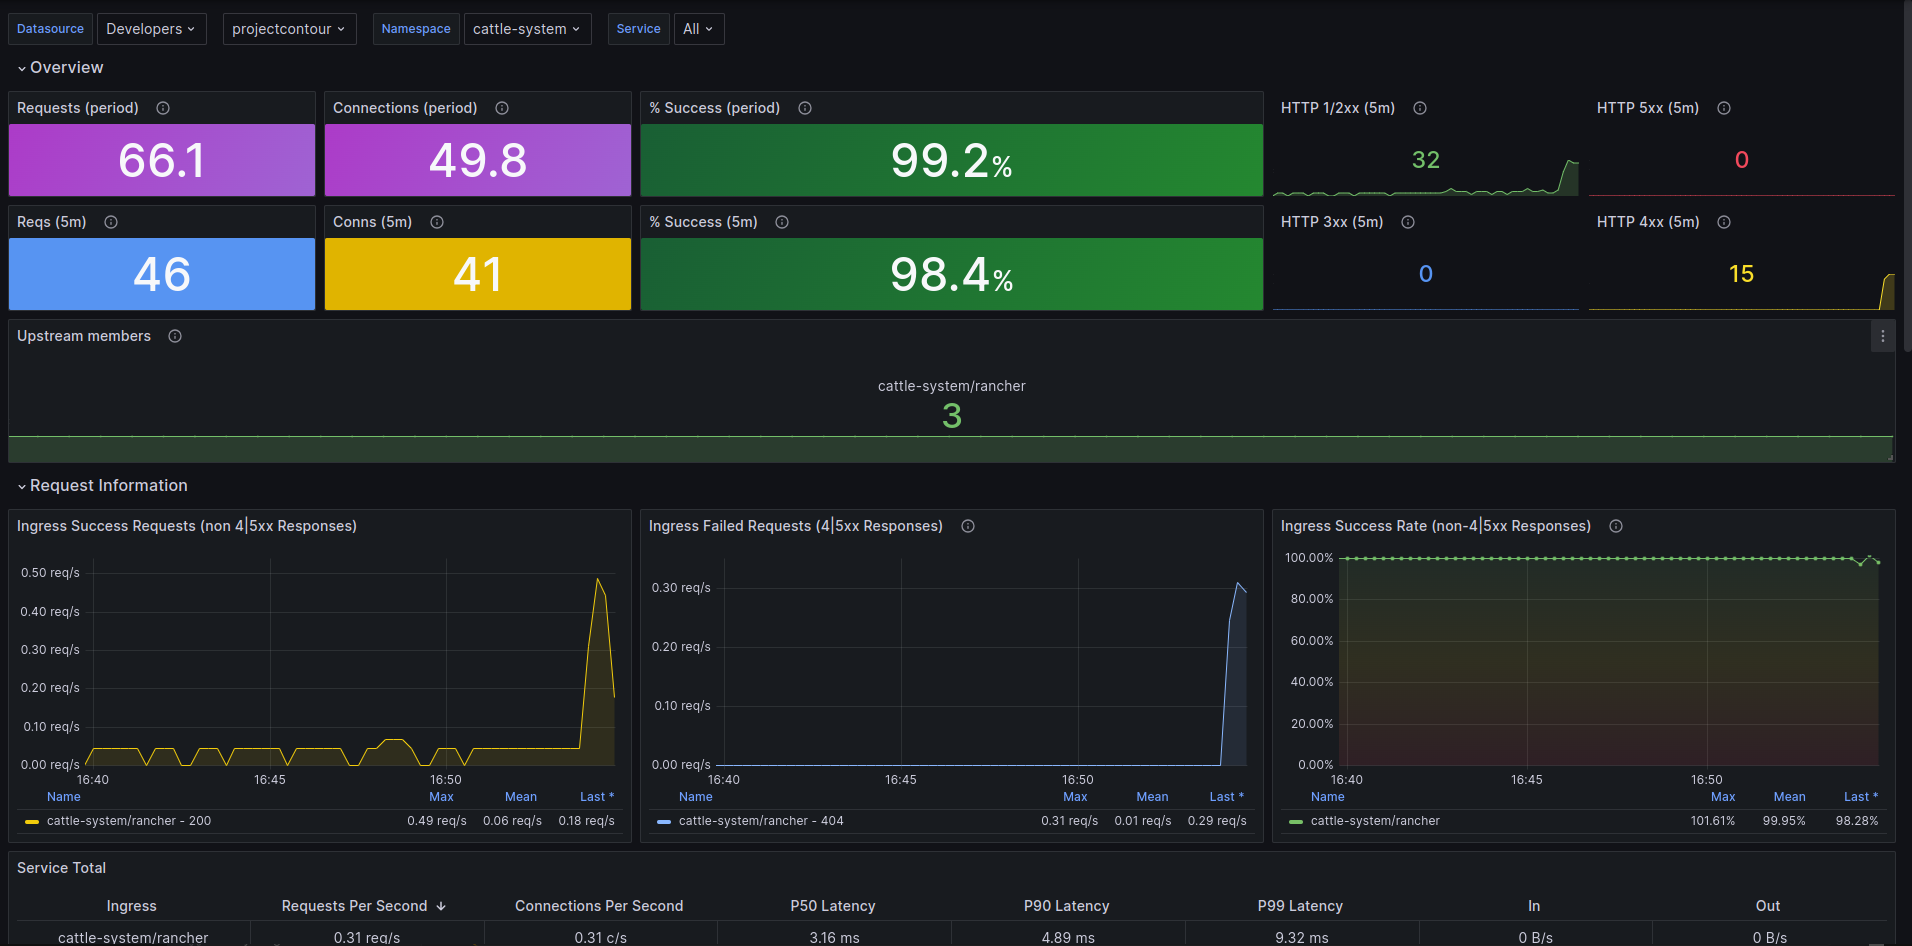
1. Overview
- Requests (period): Displays the total number of ingress requests over a specific period.
- Connections (period): Shows the total number of active connections during the period.
- % Success (period): Percentage of successful requests over the period.
- Requests (5m): Number of requests received in the last 5 minutes.
- Connections (5m): Number of connections in the last 5 minutes.
- % Success (5m): Success rate of requests in the last 5 minutes.
- HTTP Status Codes (5m): Breakdown of HTTP status codes (1xx, 2xx, 3xx, 4xx, 5xx) for the last 5 minutes.
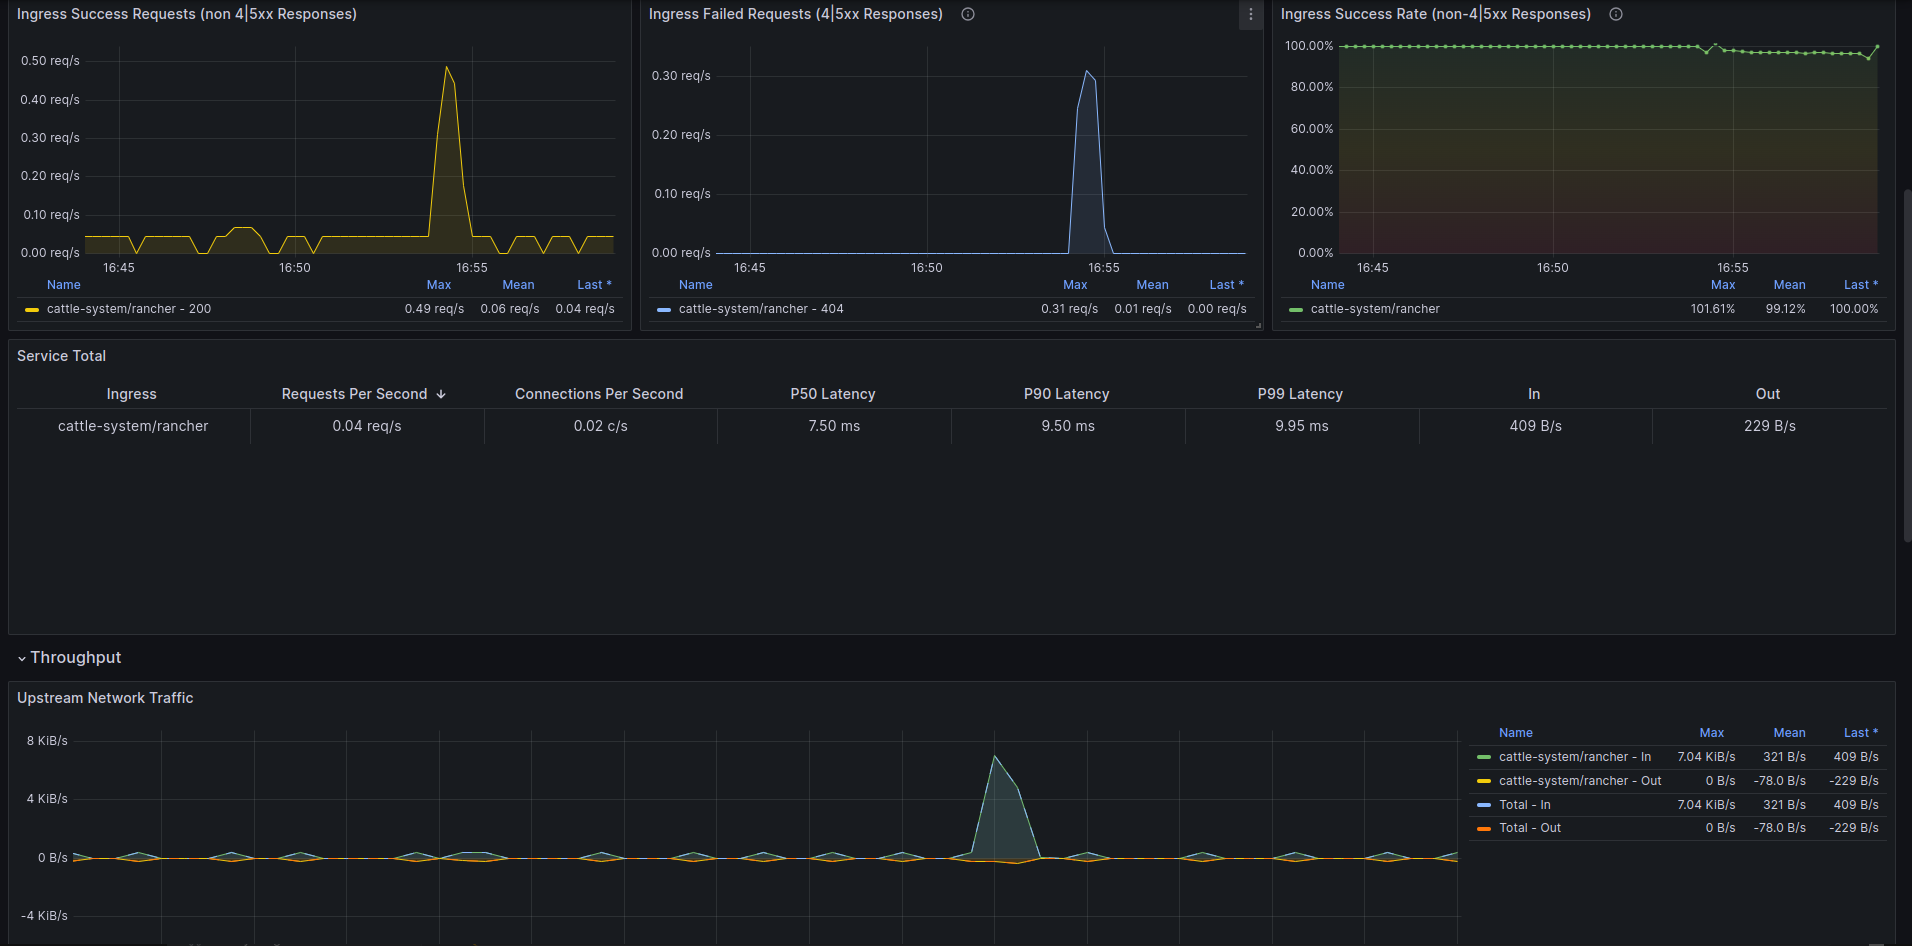
2. Request Information
- Ingress Success Requests (non 4|5xx Responses): Rate of successful ingress requests.
- Ingress Failed Requests (4|5xx Responses): Rate of failed ingress requests.
- Ingress Success Rate (non-4|5xx Responses): Success rate of ingress requests excluding 4xx and 5xx responses.
3. Service Summary
- Ingress: Overall ingress metrics.
- Requests Per Second: Rate of incoming requests per second.
- Connections Per Second: Rate of active connections per second.
- Latency (P50, P90, P99): Latency metrics at 50th, 90th, and 99th percentiles.
4. Throughput
- Upstream Network Traffic: Network traffic to upstream services.
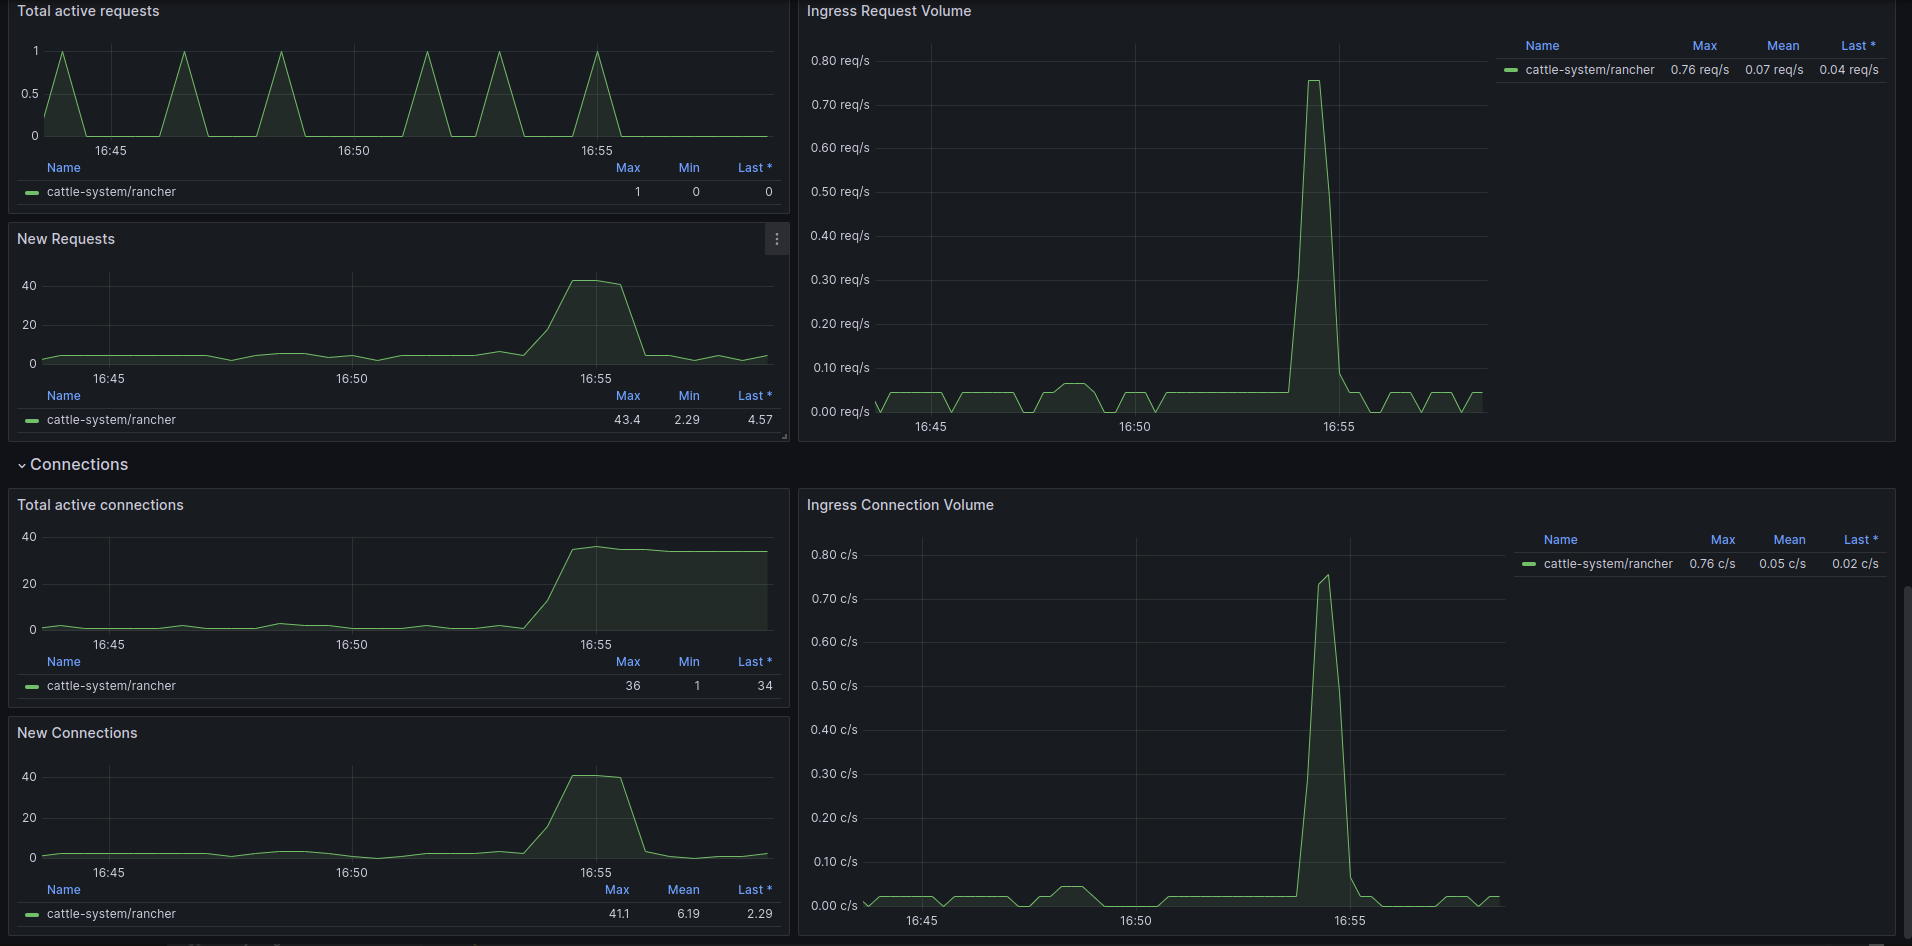
5. Requests
- Total Active Requests: Current active requests being processed.
- New Requests: Rate of new requests coming in.
- Ingress Request Volume: Volume of ingress requests over time.
6. Connections
- Total Active Connections: Number of active connections.
- New Connections: Rate of new connections being established.
- Ingress Connection Volume: Volume of connections over time.
How to Use
- Enable metrics in contour
- Select the correct data-source :)
Data source config
Collector type:
Collector plugins:
Collector config:
Revisions
Upload an updated version of an exported dashboard.json file from Grafana
| Revision | Description | Created | |
|---|---|---|---|
| Download |