Microsoft SQL Server Dashboard
Ultimate Microsoft SQL Server Monitoring. Pure T-SQL DMVs. 60+ panels: performance, memory, I/O, indexes, security, jobs, fragmentation, network, health score.
Microsoft SQL Server Dashboard — Pure T-SQL
60+ panels | 8 sections | Zero Prometheus | No exporters needed
Monitor your SQL Server instances using only native T-SQL DMVs. Connect Grafana's built-in Microsoft SQL Server data source directly to your instance — no additional tools required.
Data Source Setup
- Add a Microsoft SQL Server data source in Grafana
- Point it to your SQL Server instance (
host:1433) - Use a login with
VIEW SERVER STATEandVIEW ANY DEFINITIONpermissions (orSAfor testing) - Import this dashboard — done!
> A Docker Compose quickstart is available to test the dashboard in under 2 minutes.
Sections
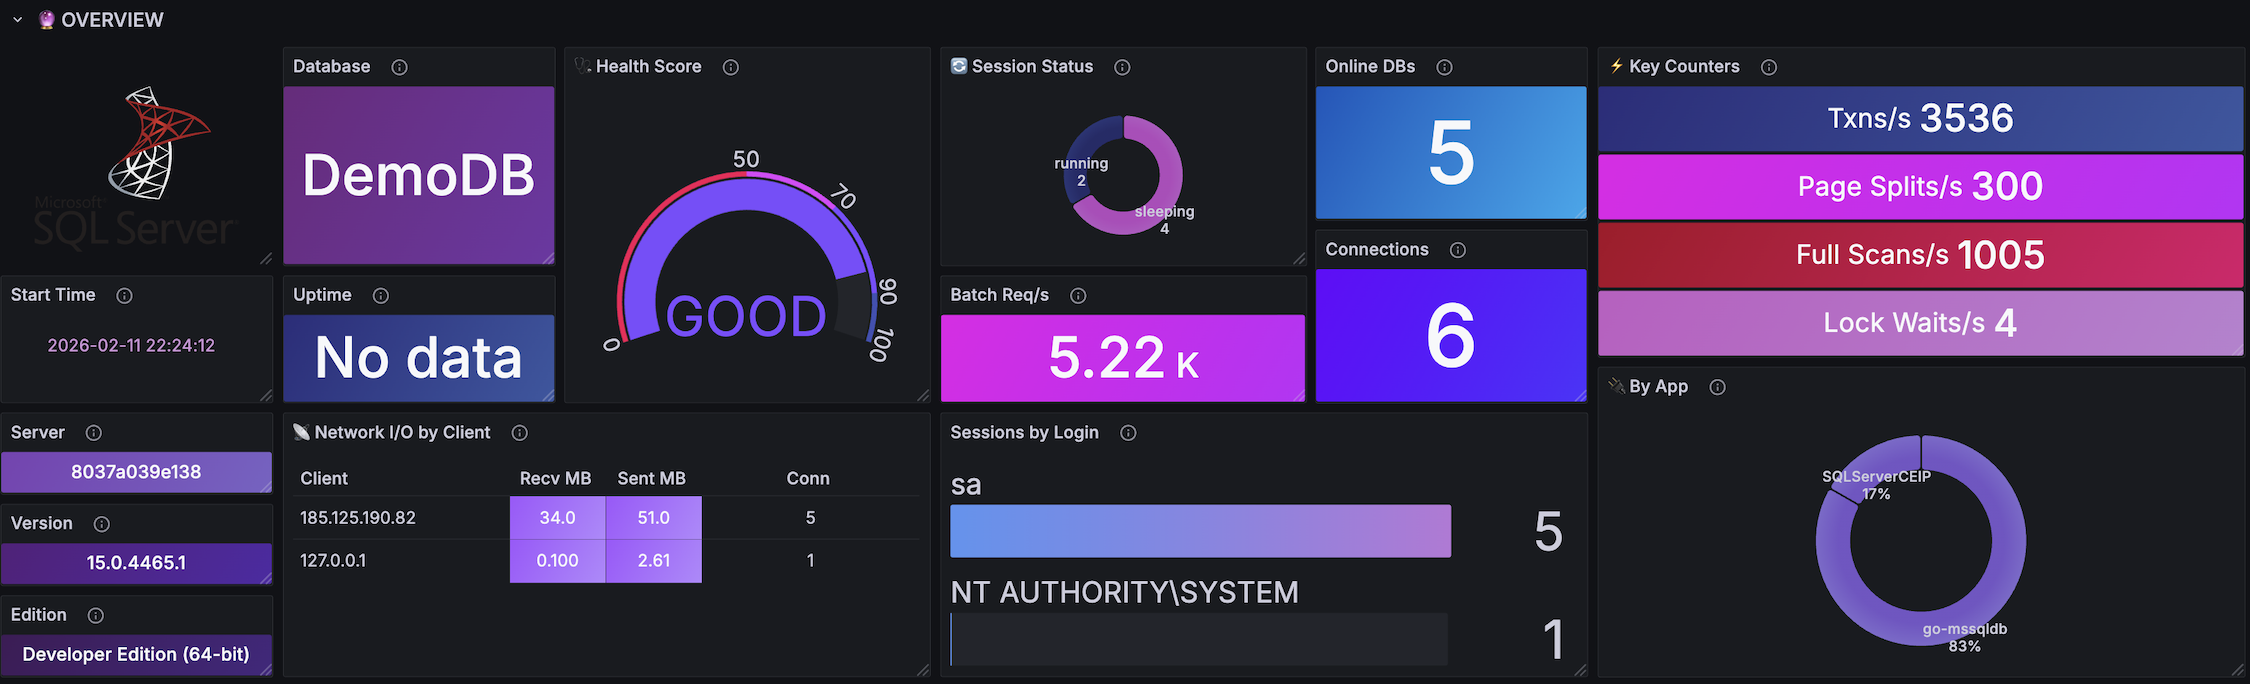
🔮 Overview
🩺 Health Score (composite 0–100 gauge) · Server info (DB, version, edition, server name, uptime) · Batch Requests/s · Transactions/s · Page Splits/s · Full Scans/s · Lock Waits/s · Active sessions by login · Connections by application · Session status breakdown · Network I/O per client · Start time
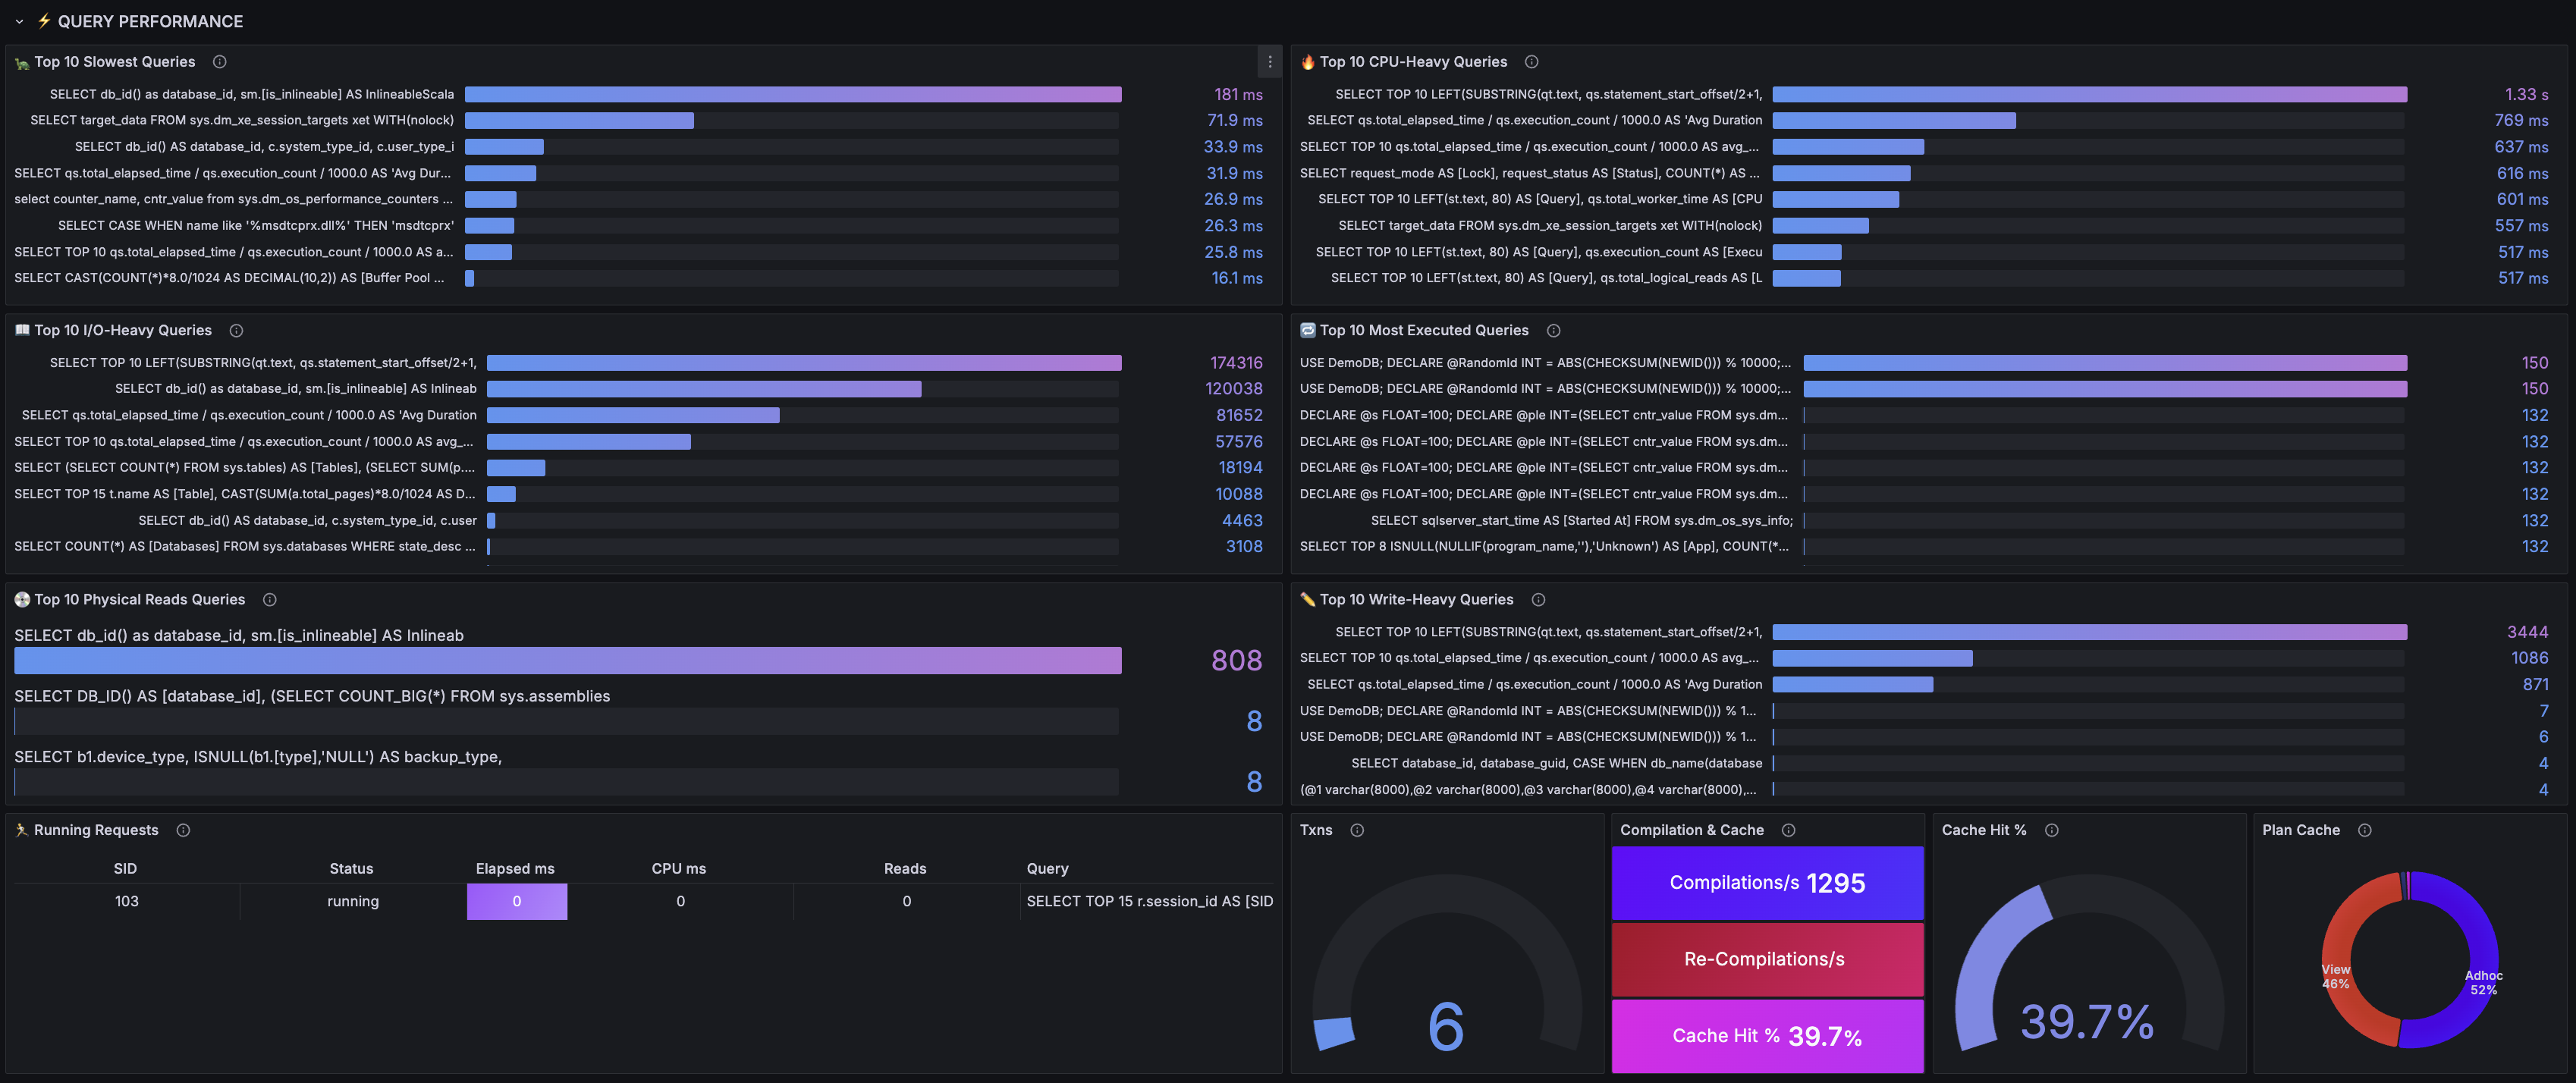
⚡ Query Performance
Top 10 slowest queries · Top 10 CPU-heavy queries · Top 10 I/O-heavy queries (logical reads) · Top 10 most executed queries · Top 10 physical reads queries · Top 10 write-heavy queries · Compilations/s & Re-Compilations/s & Cache Hit % · Plan cache by type (donut) · Currently running requests (live table) · Cache Hit / Connections / Active Transactions gauges
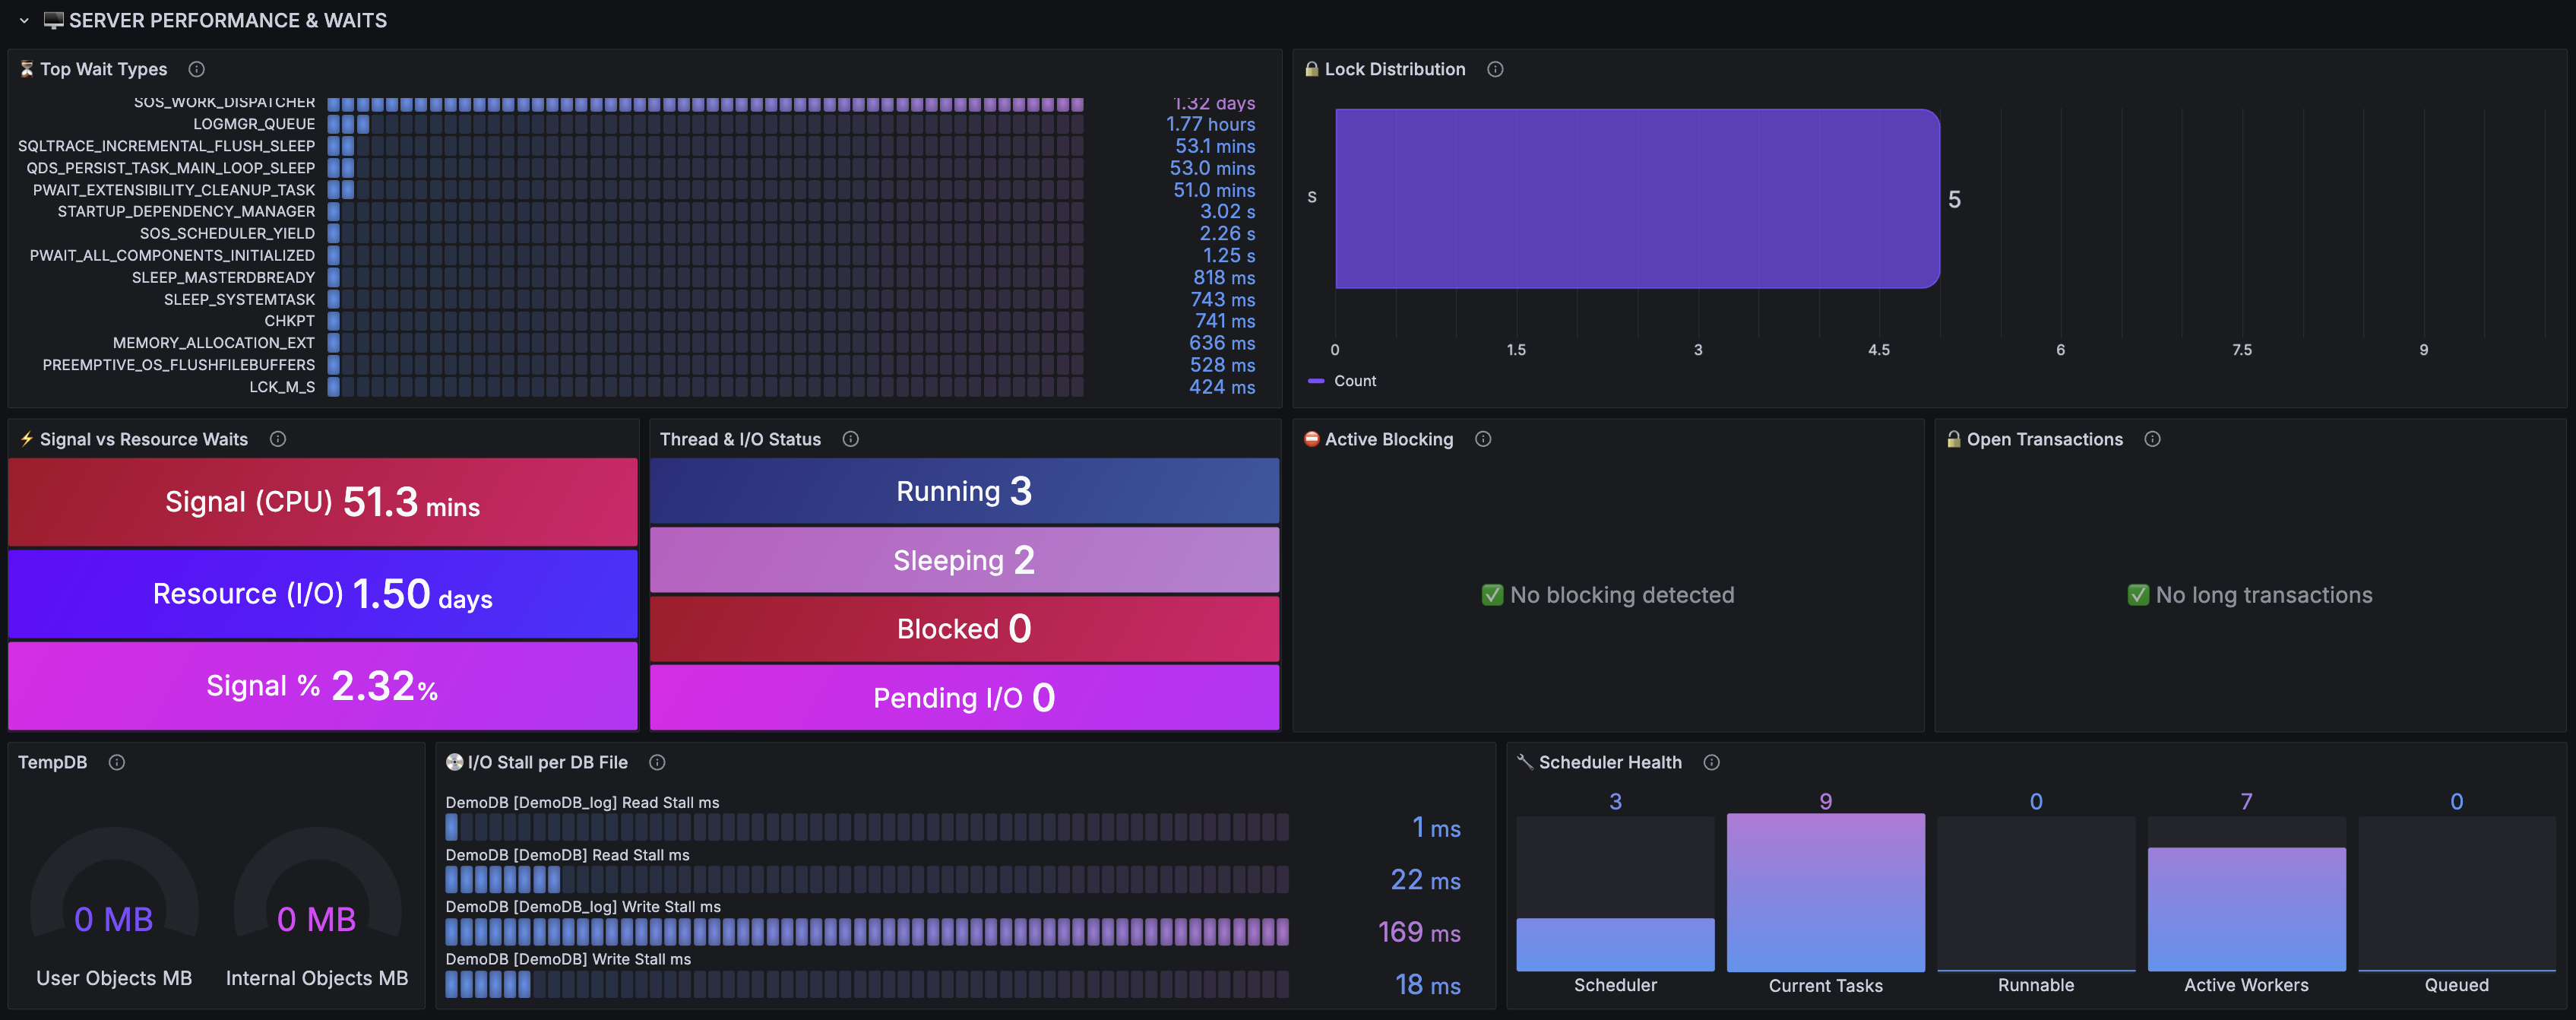
🖥 Server Performance & Waits
Top 15 wait types (excludes benign waits) · Lock distribution by mode/status · Signal vs Resource waits (CPU vs I/O pressure) · Running / Sleeping / Blocked / Pending I/O counts · Active blocking chains · Open transactions with duration · TempDB allocation · I/O stall per DB file · Scheduler health per CPU
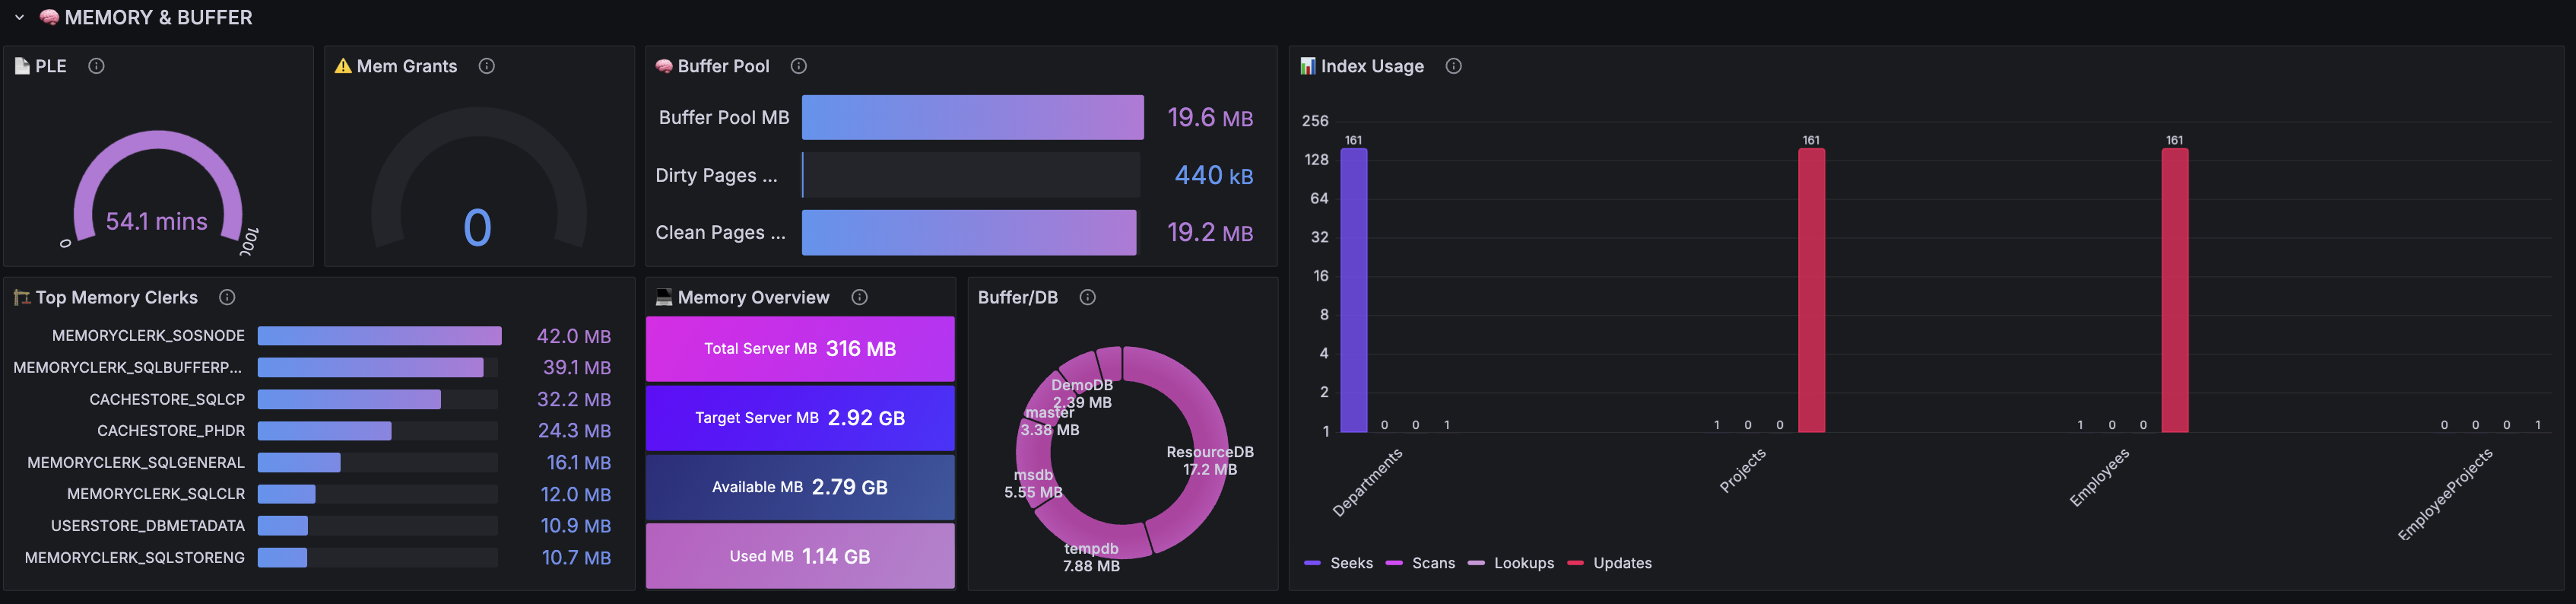
🧠 Memory & Buffer
Page Life Expectancy gauge · Memory Grants Pending gauge · Buffer Pool breakdown (clean/dirty) · Memory overview (Total/Target/Available/Used) · Top 10 memory clerks · Buffer pool per database (donut) · Index usage per table (seeks/scans/lookups/updates)
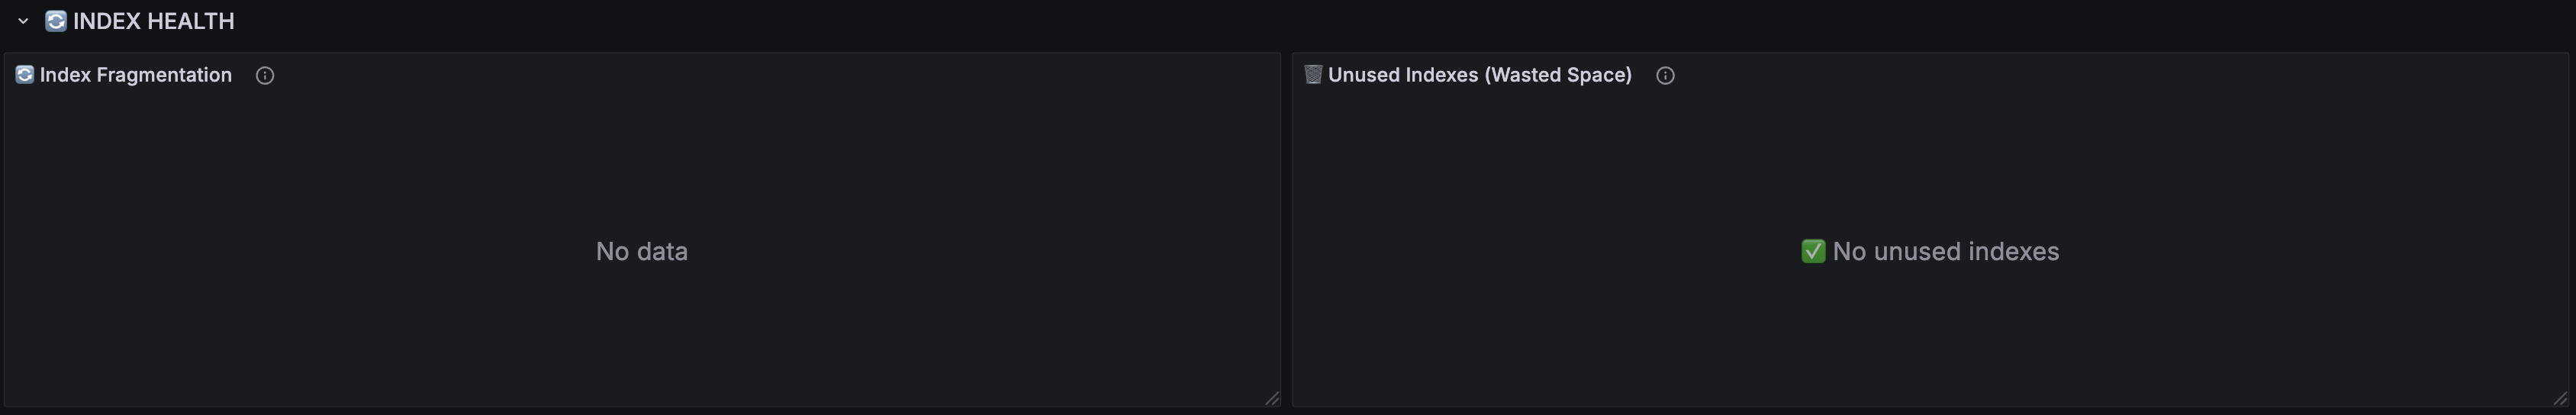
🔄 Index Health
Index fragmentation with REBUILD / REORGANIZE / OK recommendations · Unused indexes (zero reads, ongoing write cost)
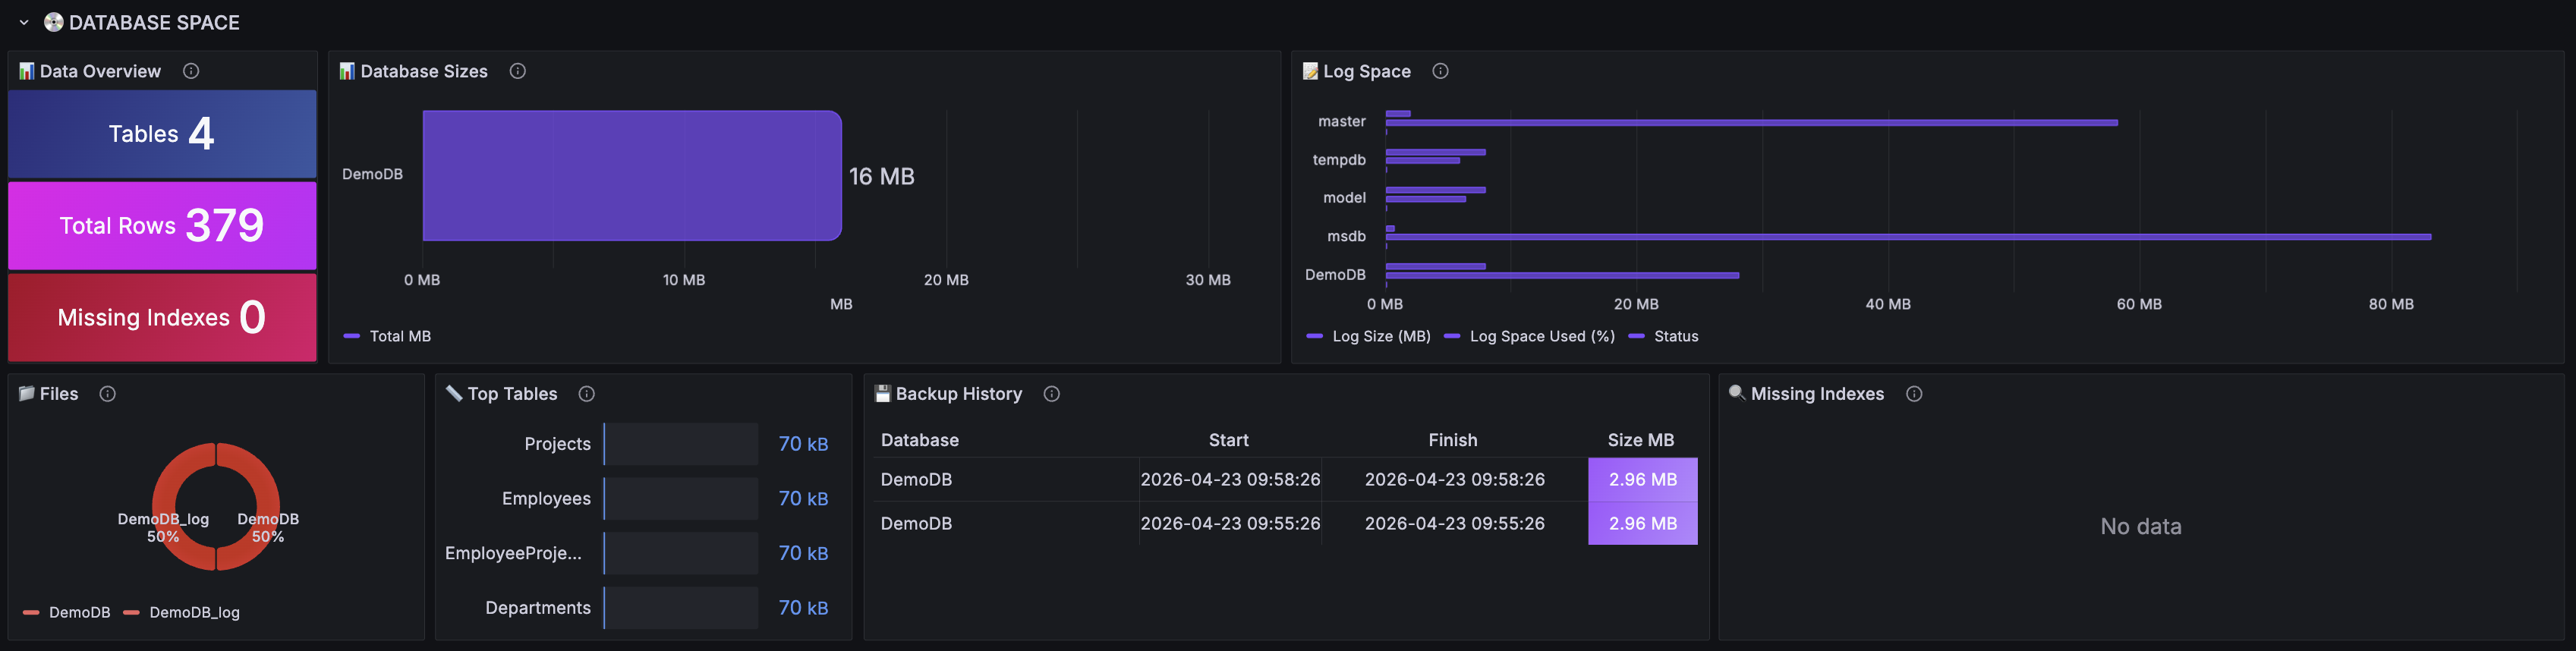
💿 Database Space
Database sizes · Transaction log space · File distribution (donut) · Top 15 tables by size · Backup history · Data overview (tables count, total rows, missing indexes) · Missing index suggestions from the optimizer
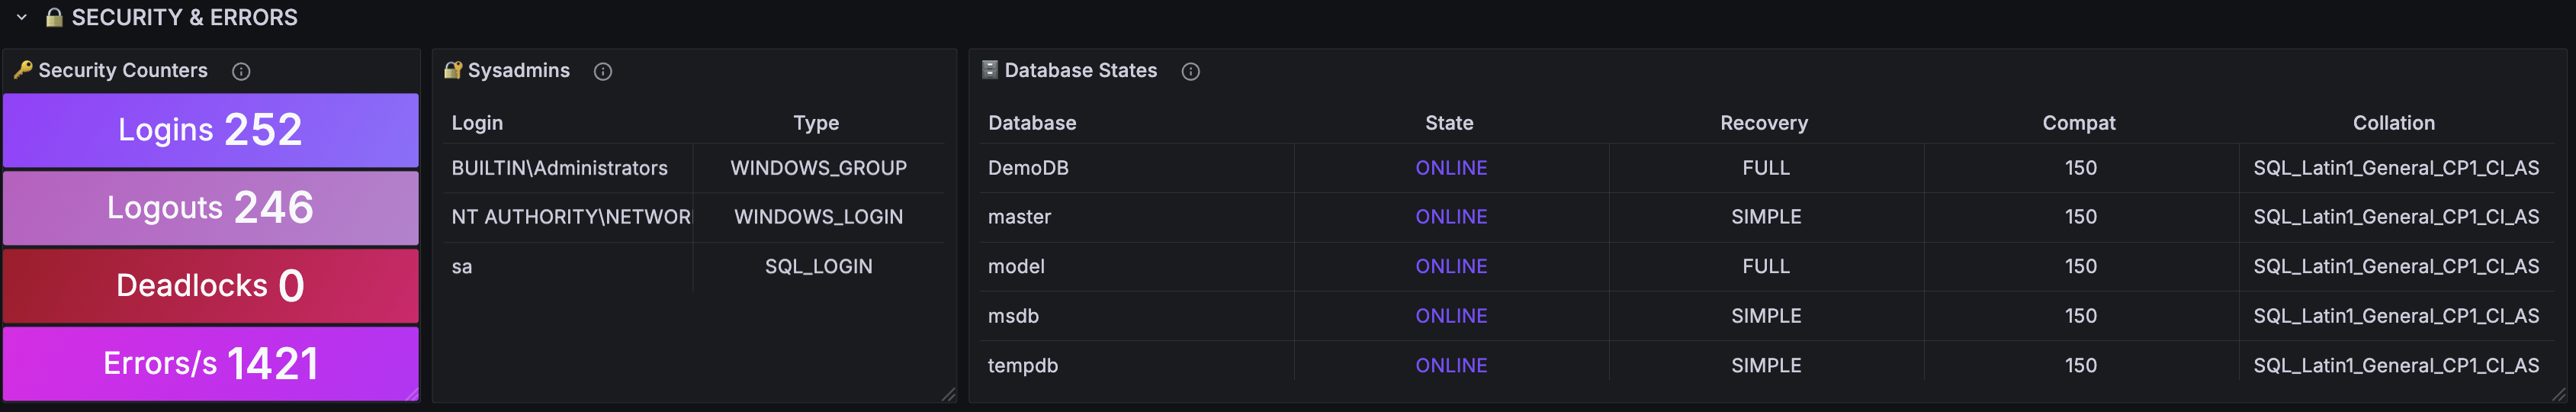
🔒 Security & Errors
Logins / Logouts / Deadlocks / Errors counters · Sysadmin role members (security audit) · Database states with recovery model and compatibility level
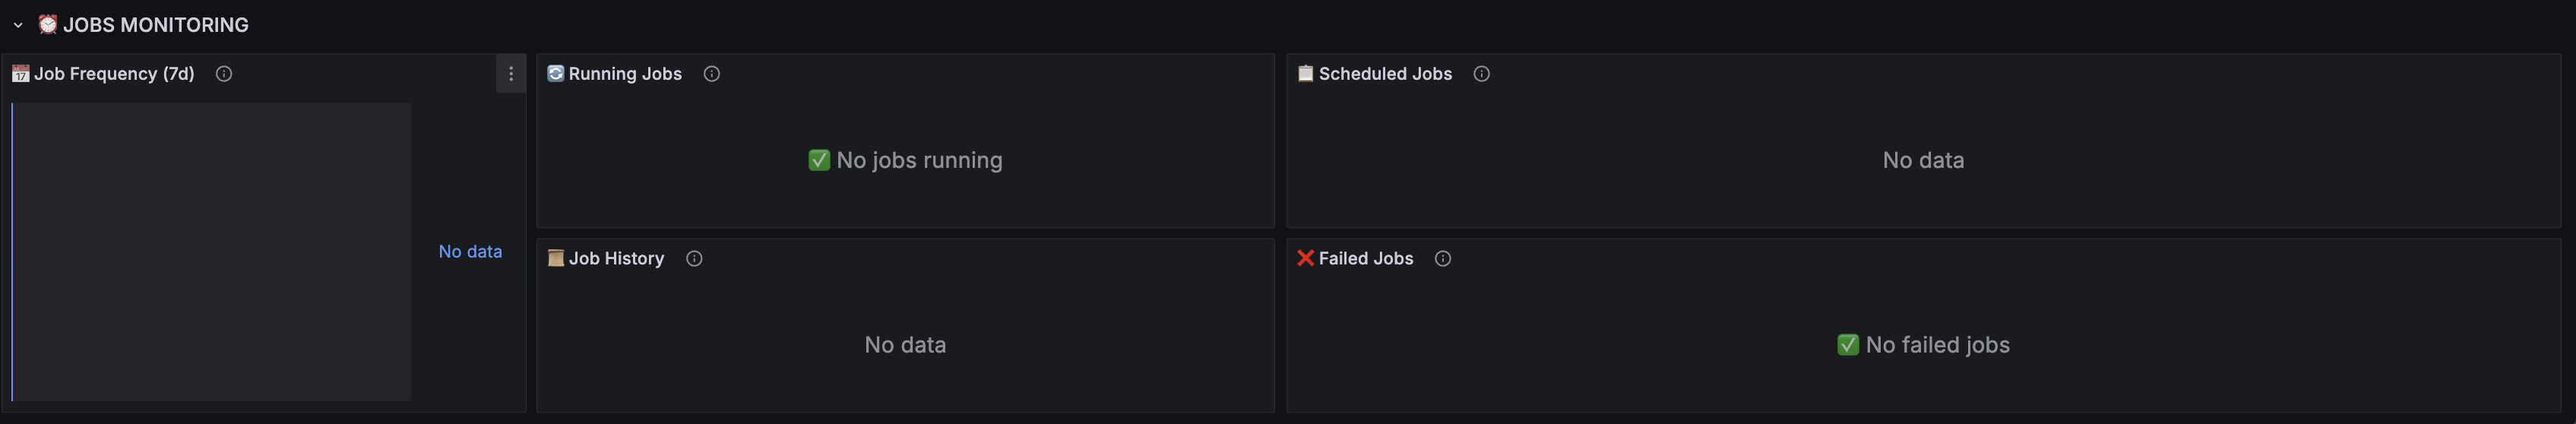
⏰ Jobs Monitoring
Job frequency (last 7 days) · Running jobs with duration · Scheduled jobs · Job history · Failed jobs with error messages
How It Works
All panels query SQL Server DMVs (Dynamic Management Views) directly via the Grafana MSSQL data source. No Prometheus, no exporters, no agents.
Key DMVs used: sys.dm_exec_query_stats · sys.dm_exec_sessions · sys.dm_os_performance_counters · sys.dm_os_wait_stats · sys.dm_os_buffer_descriptors · sys.dm_os_sys_memory · sys.dm_os_memory_clerks · sys.dm_os_schedulers · sys.dm_tran_locks · sys.dm_tran_active_transactions · sys.dm_io_virtual_file_stats · sys.dm_db_index_usage_stats · sys.dm_db_index_physical_stats · sys.dm_db_missing_index_details · sys.dm_exec_query_memory_grants · sys.dm_exec_connections · msdb.dbo.sysjobs · msdb.dbo.sysjobhistory
Full metrics reference: docs/metrics.md
Contributions welcome on GitHub — give it a ⭐️ if you find it useful!
Data source config
Collector config:
Upload an updated version of an exported dashboard.json file from Grafana
| Revision | Description | Created | |
|---|---|---|---|
| Download |
Microsoft Azure Observability
Easily visualize and alert on Microsoft Azure Service resources using the fully managed Grafana Cloud platform.
Learn more