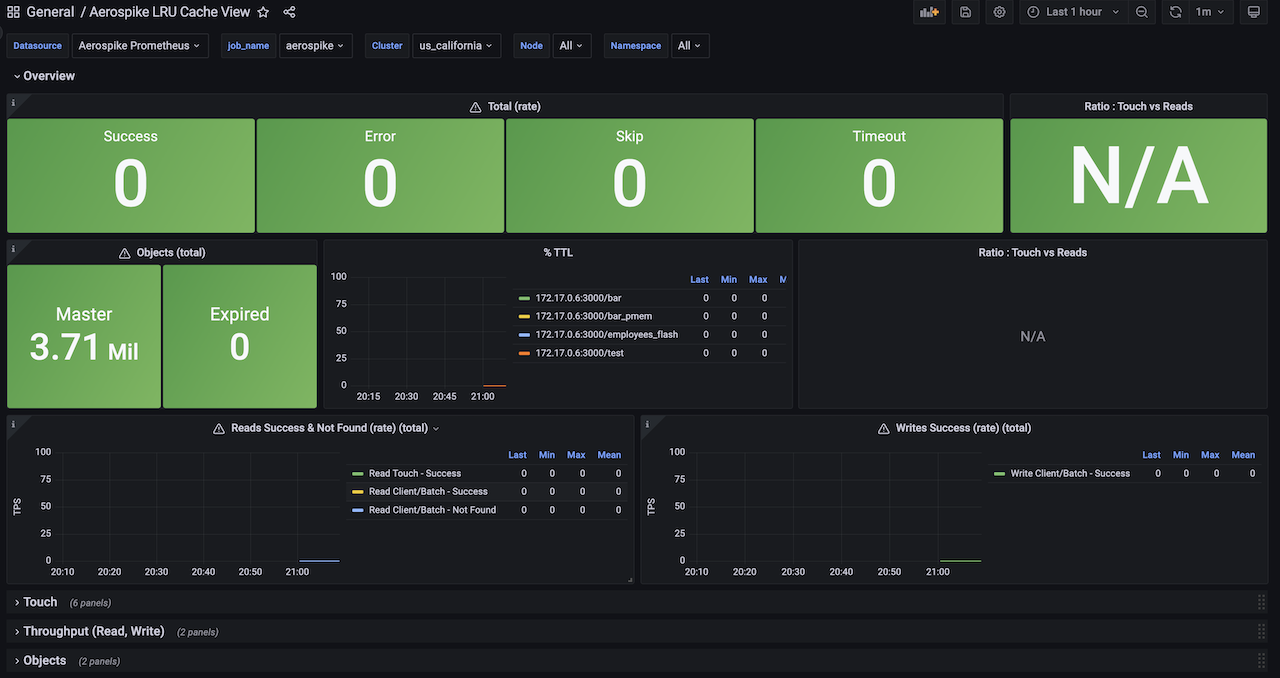
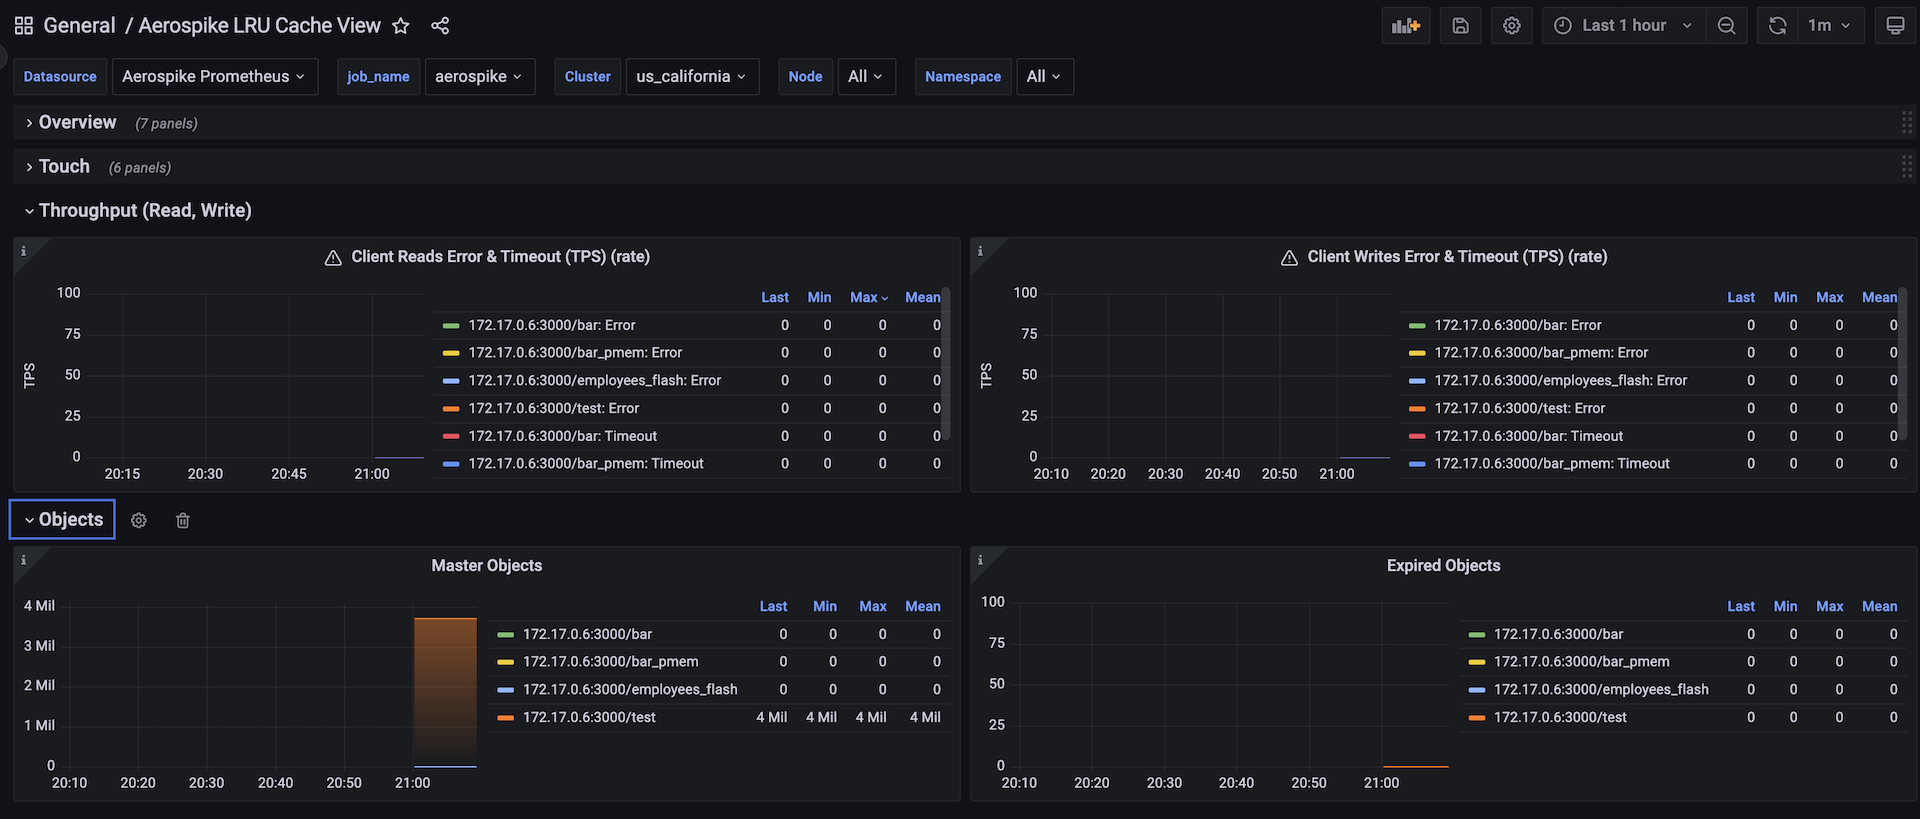
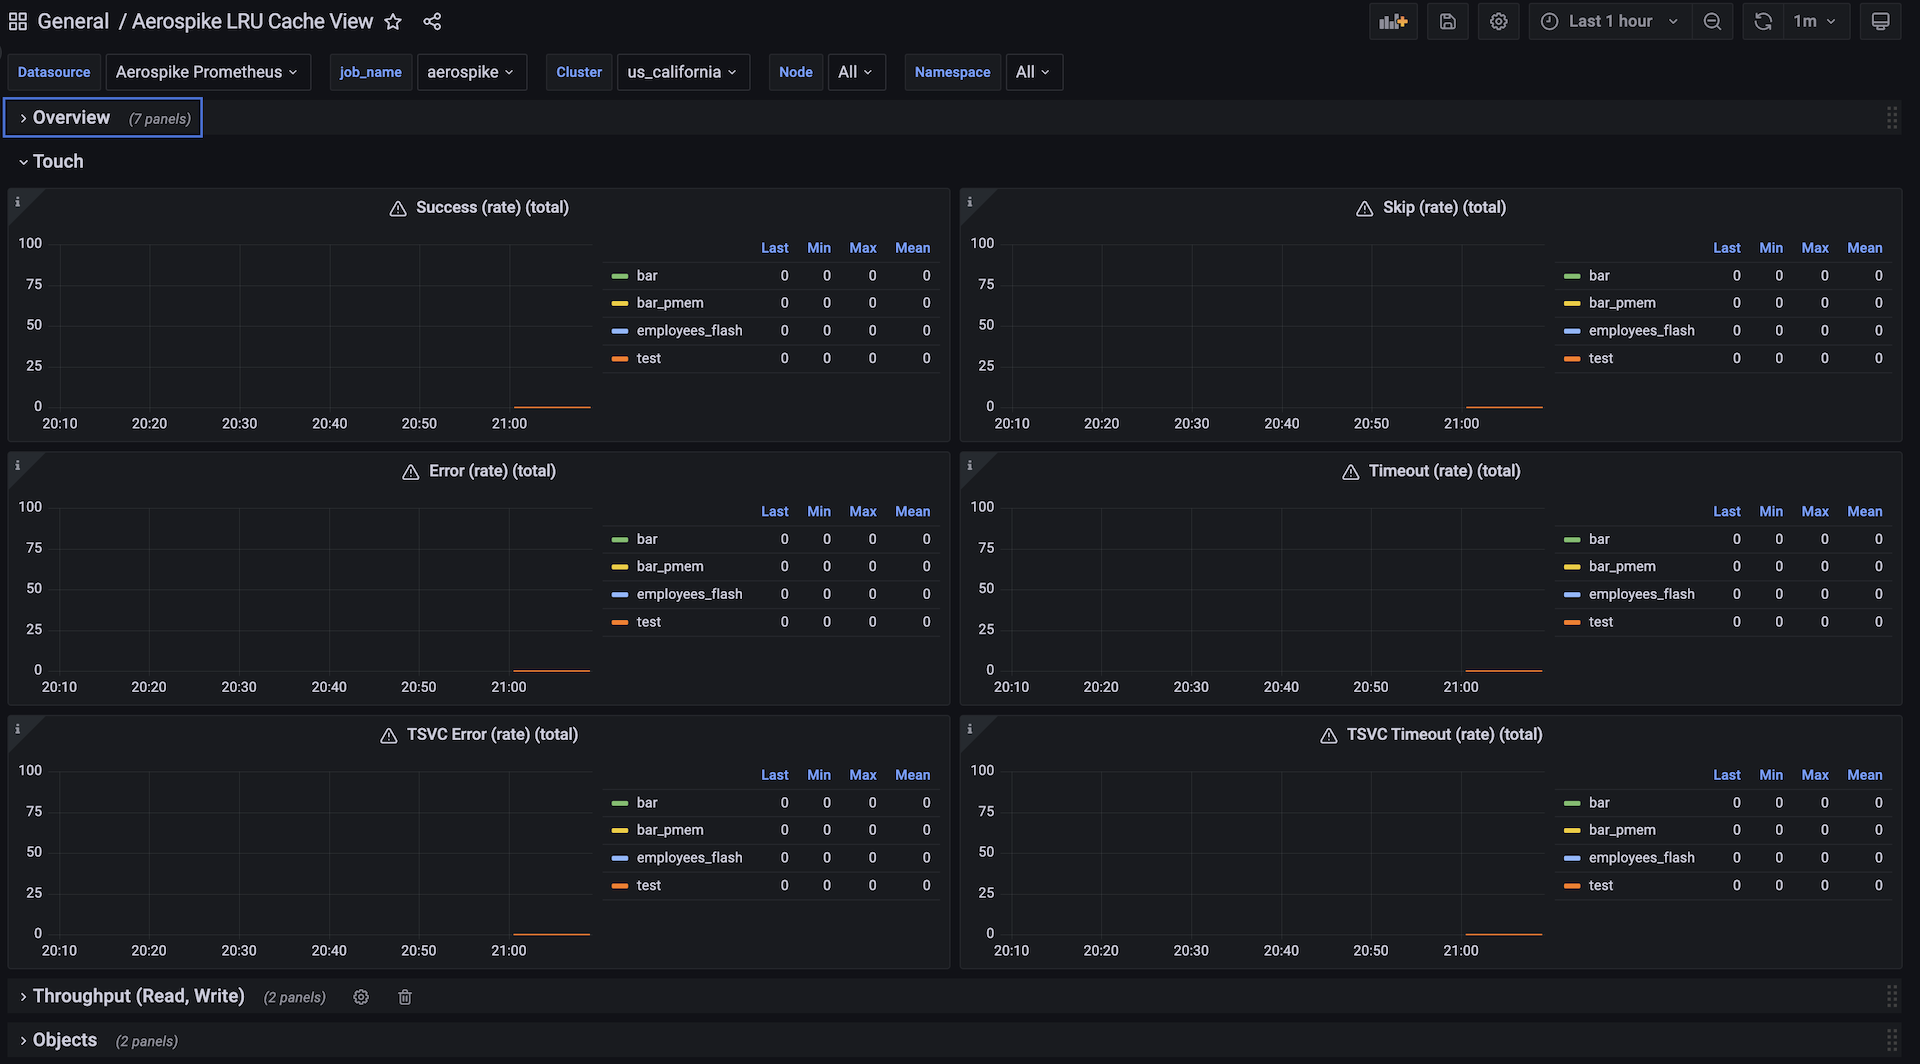
Aerospike LRU Cache View
a usecase dashboard, to view various key metrics useful while using aerospike as a distributed cache, dashboard displays key metrics like read_success, errors, timeouts etc.,
Aerospike Outbound Connector View dashboard for Aerospike Monitoring Stack
This dashboard covers key read related metrics to be monitored while using Aerospike as a distributed cache
Aerospike's Monitoring Stack extracts operational metrics from Aerospike database clusters for visualization and analysis in Prometheus and Grafana.
See Aerospike Monitoring Stack Architecture and Aerospike Monitoring Stack Installation for more details
Data source config
Collector config:
Upload an updated version of an exported dashboard.json file from Grafana
| Revision | Description | Created | |
|---|---|---|---|
| Download |
Aerospike
Easily monitor Aerospike, a multi-modal NoSQL and graph database, with Grafana Cloud's out-of-the-box monitoring solution.
Learn more