GraphQL Engine OpenTelemetry
Hasura GraphQL Engine dashboards for monitoring OpenTelemetry exporter
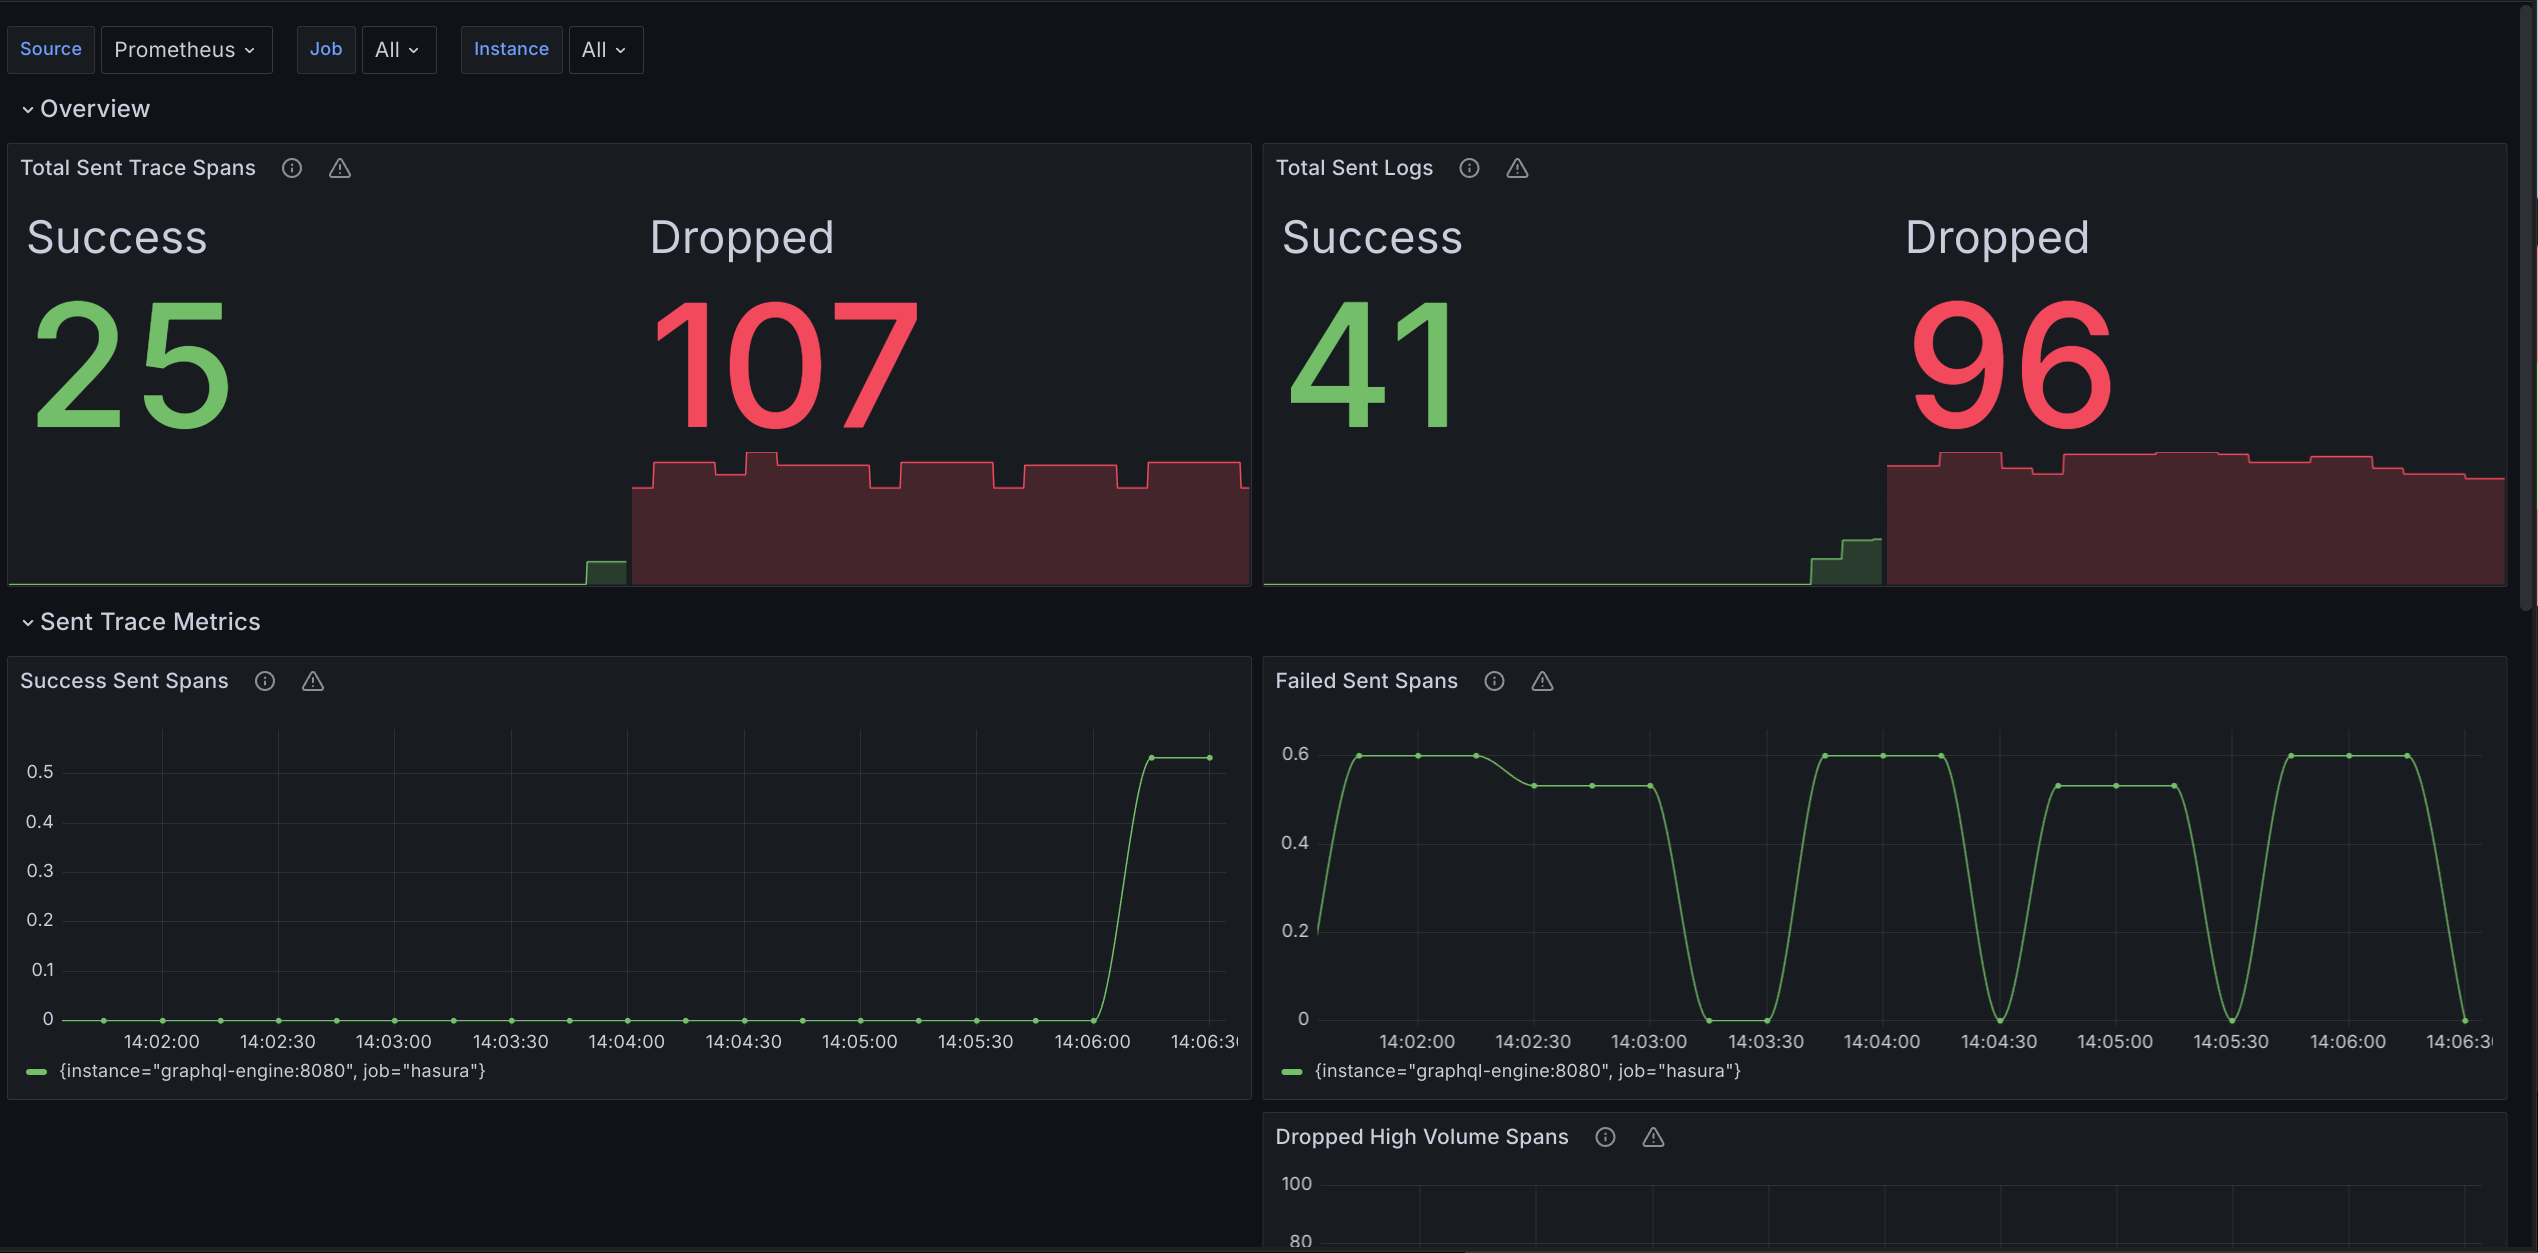
The dashboard visualizes Prometheus metrics of OpenTelemetry reliability that are emitted from Hasura GraphQL Engine Enterprise Edition. See Prometheus Integration with Hasura EE for more information.
You need to enable Hasura EE with a valid license key. If you don't have one, you can get a license key via a 30-day free trial or by contacting the Hasura team.
Data source config
Collector type:
Collector plugins:
Collector config:
Revisions
Upload an updated version of an exported dashboard.json file from Grafana
| Revision | Description | Created | |
|---|---|---|---|
| Download |