Spring Boot Resilience4j Circuit Breaker (3.x)
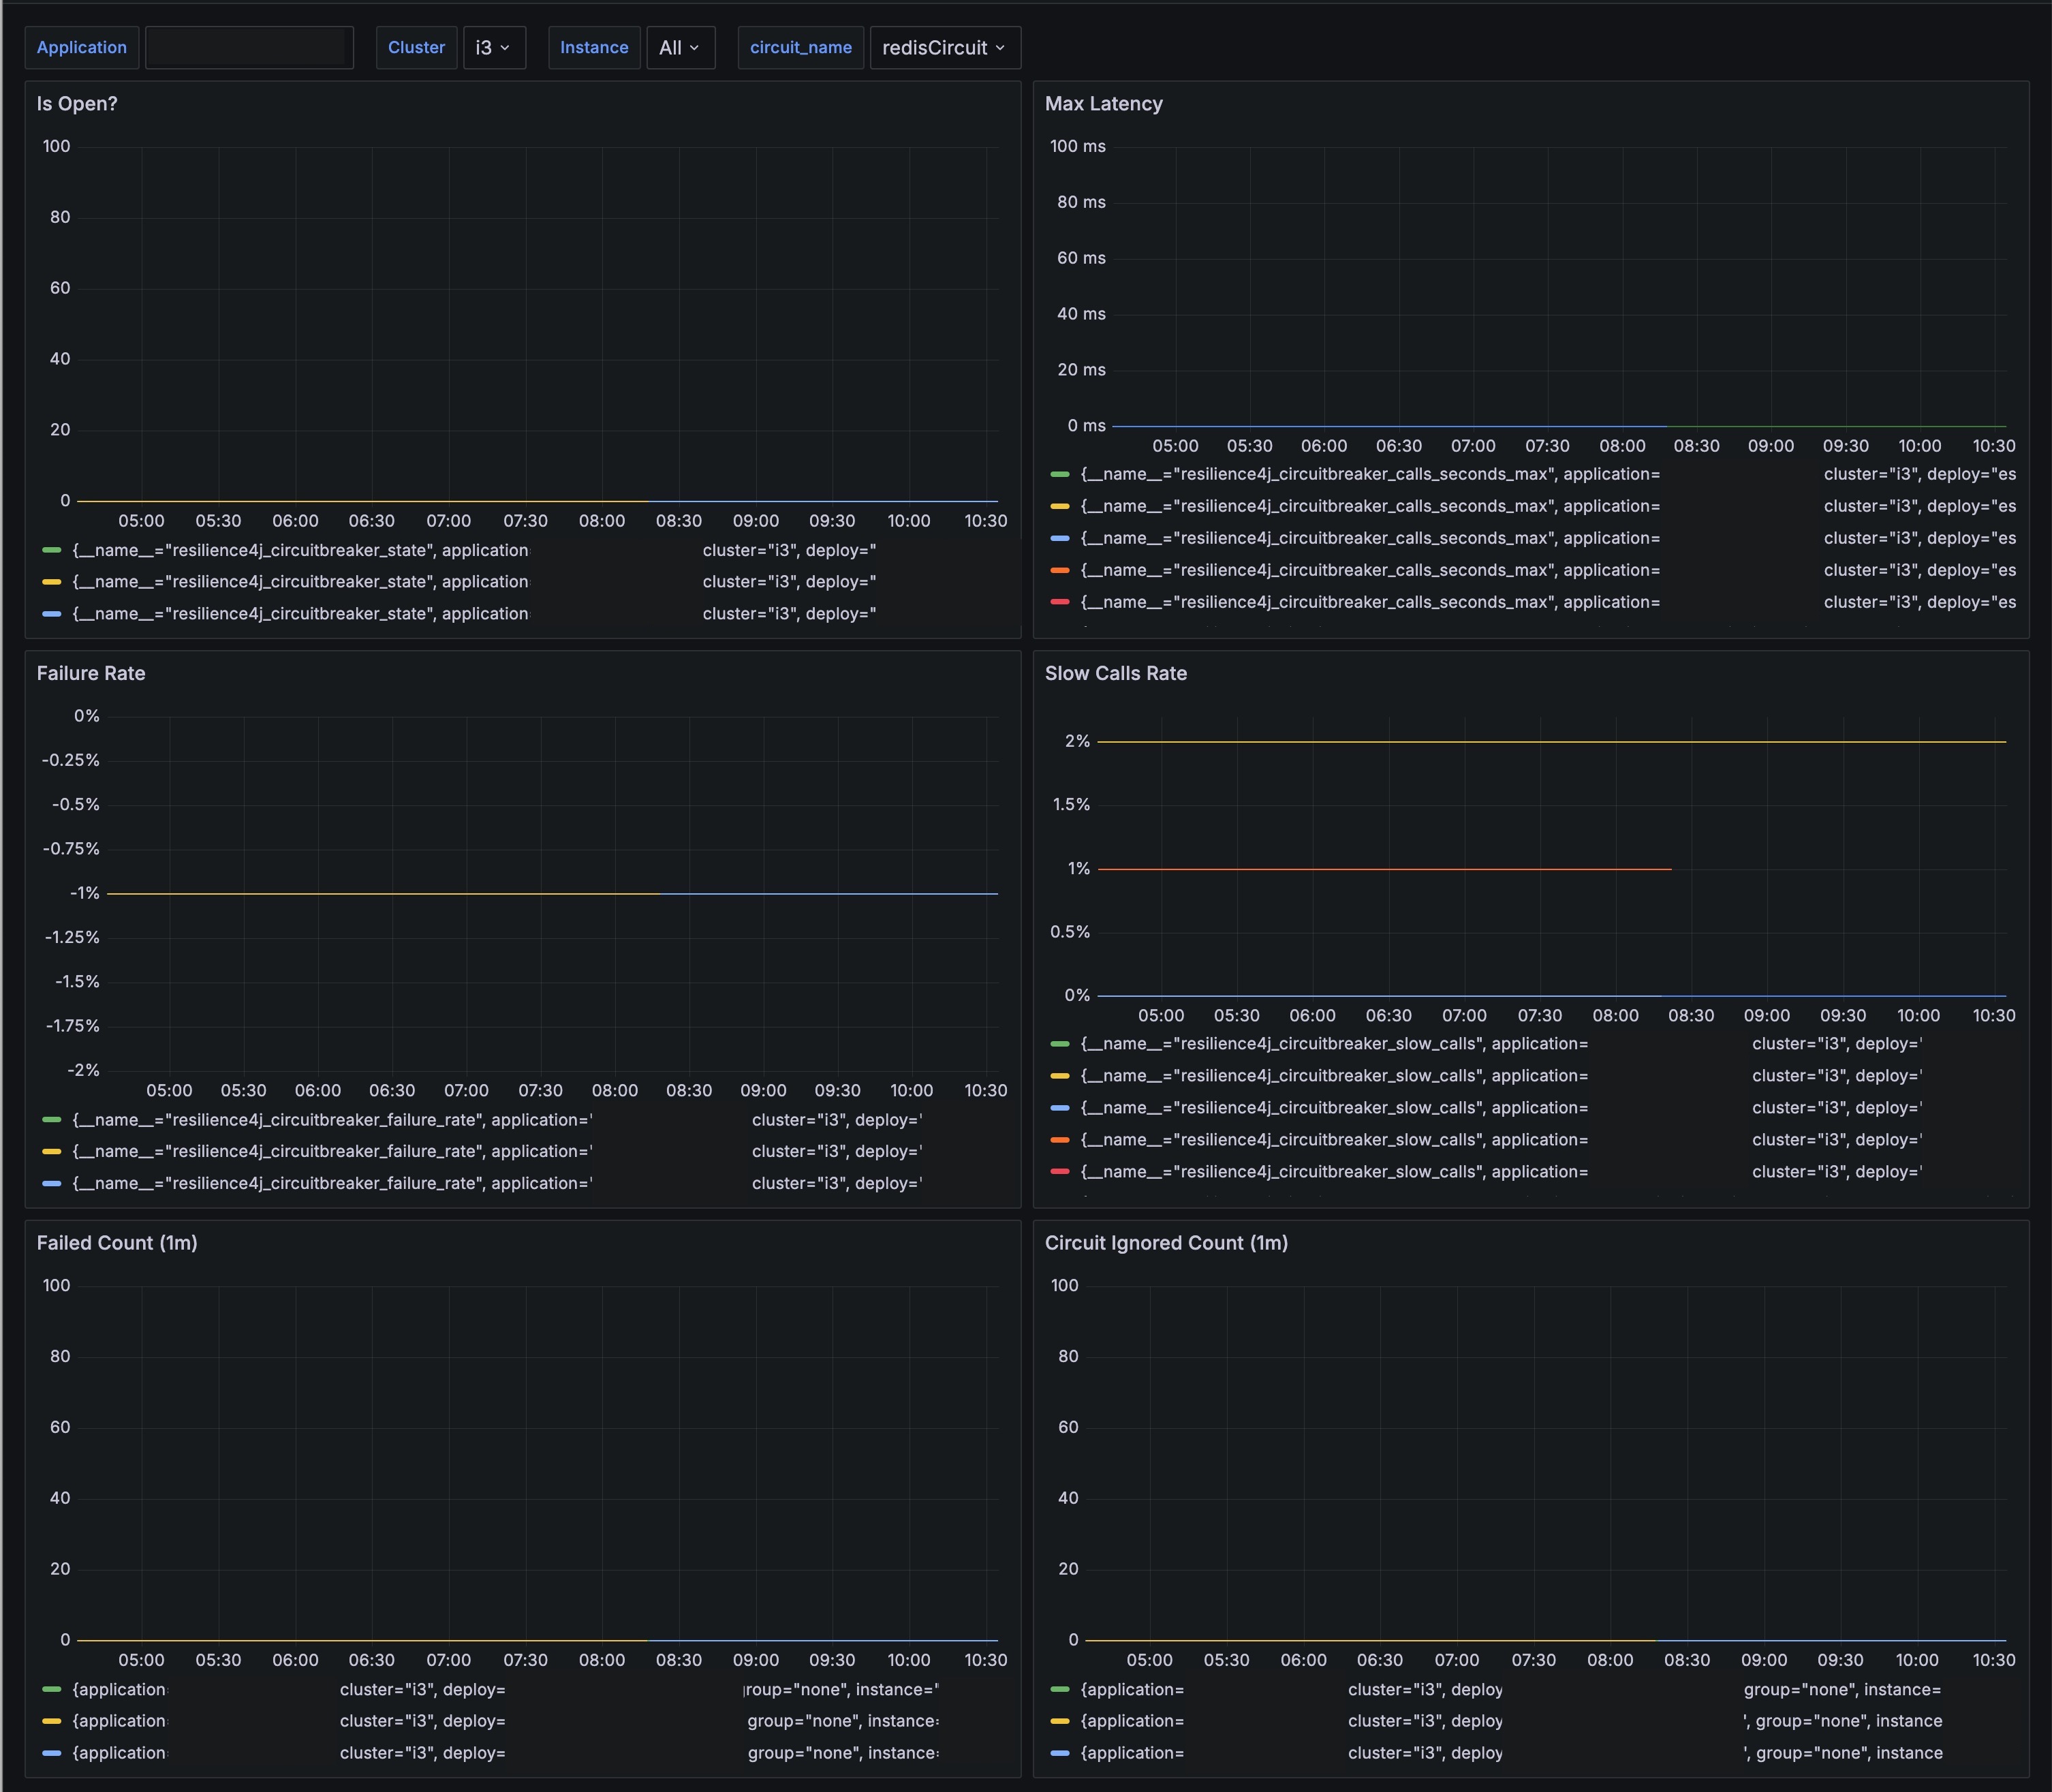
This dashboard provides real-time monitoring of the Resilience4j Circuit Breakers implemented in the Spring Boot application, using Spring Boot Actuator and Prometheus for data collection and visualization.
Introduction
This dashboard is designed to monitor the health and performance of Resilience4j Circuit Breakers in a Spring Boot application. It uses Spring Boot Actuator to expose metrics and Prometheus to collect and store these metrics. Grafana is then used to visualize the collected data, providing insights into the behavior of the circuit breakers.
Panels Overview
Is Open?
- Description: Displays whether the circuit breaker is currently open (tripped) or closed (normal operation). This helps in identifying if the circuit breaker has tripped due to failures.
- Metrics:
resilience4j_circuitbreaker_state
Max Latency
- Description: Shows the maximum latency observed in the calls monitored by the circuit breaker. This helps in understanding the performance impact on the system.
- Metrics:
resilience4j_circuitbreaker_calls_seconds_max
Failure Rate
- Description: Indicates the failure rate of the calls in percentage. High failure rates might indicate issues with the downstream services or network.
- Metrics:
resilience4j_circuitbreaker_failure_rate
Slow Calls Rate
- Description: Displays the percentage of calls that are considered slow based on the configured threshold. Helps in identifying performance degradation.
- Metrics:
resilience4j_circuitbreaker_slow_calls
Failed Count (1m)
- Description: Counts the number of failed calls in the last minute. This can help in identifying recent spikes in failures.
- Metrics:
resilience4j_circuitbreaker_failure_rate
Circuit Ignored Count (1m)
- Description: Shows the count of ignored calls by the circuit breaker in the last minute. Ignored calls are those that were not considered by the circuit breaker due to its policy.
- Metrics:
resilience4j_circuitbreaker_ignored_calls
This dashboard is essential for maintaining the resilience and performance of microservices, allowing developers and operators to identify and address issues proactively.
Data source config
Collector config:
Upload an updated version of an exported dashboard.json file from Grafana
| Revision | Description | Created | |
|---|---|---|---|
| Download |
Spring Boot
Easily monitor Spring Boot with Grafana Cloud's out-of-the-box monitoring solution.
Learn more
