
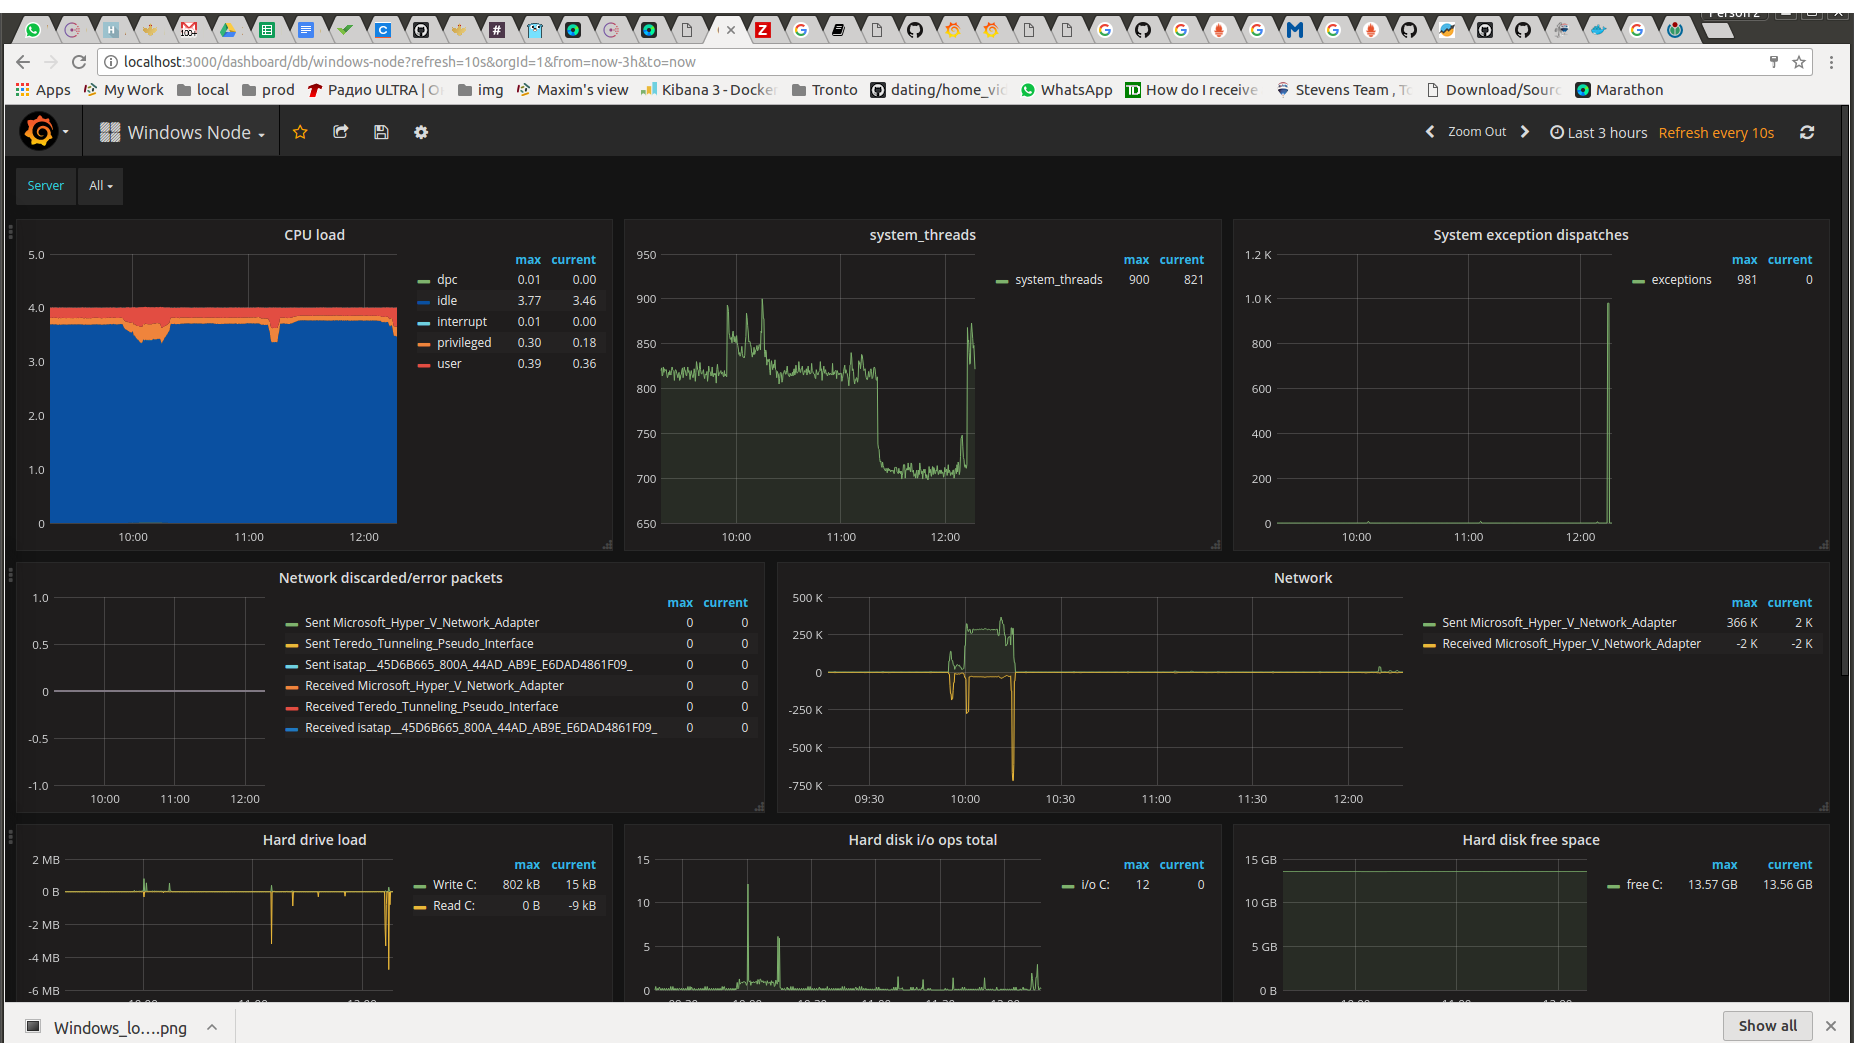
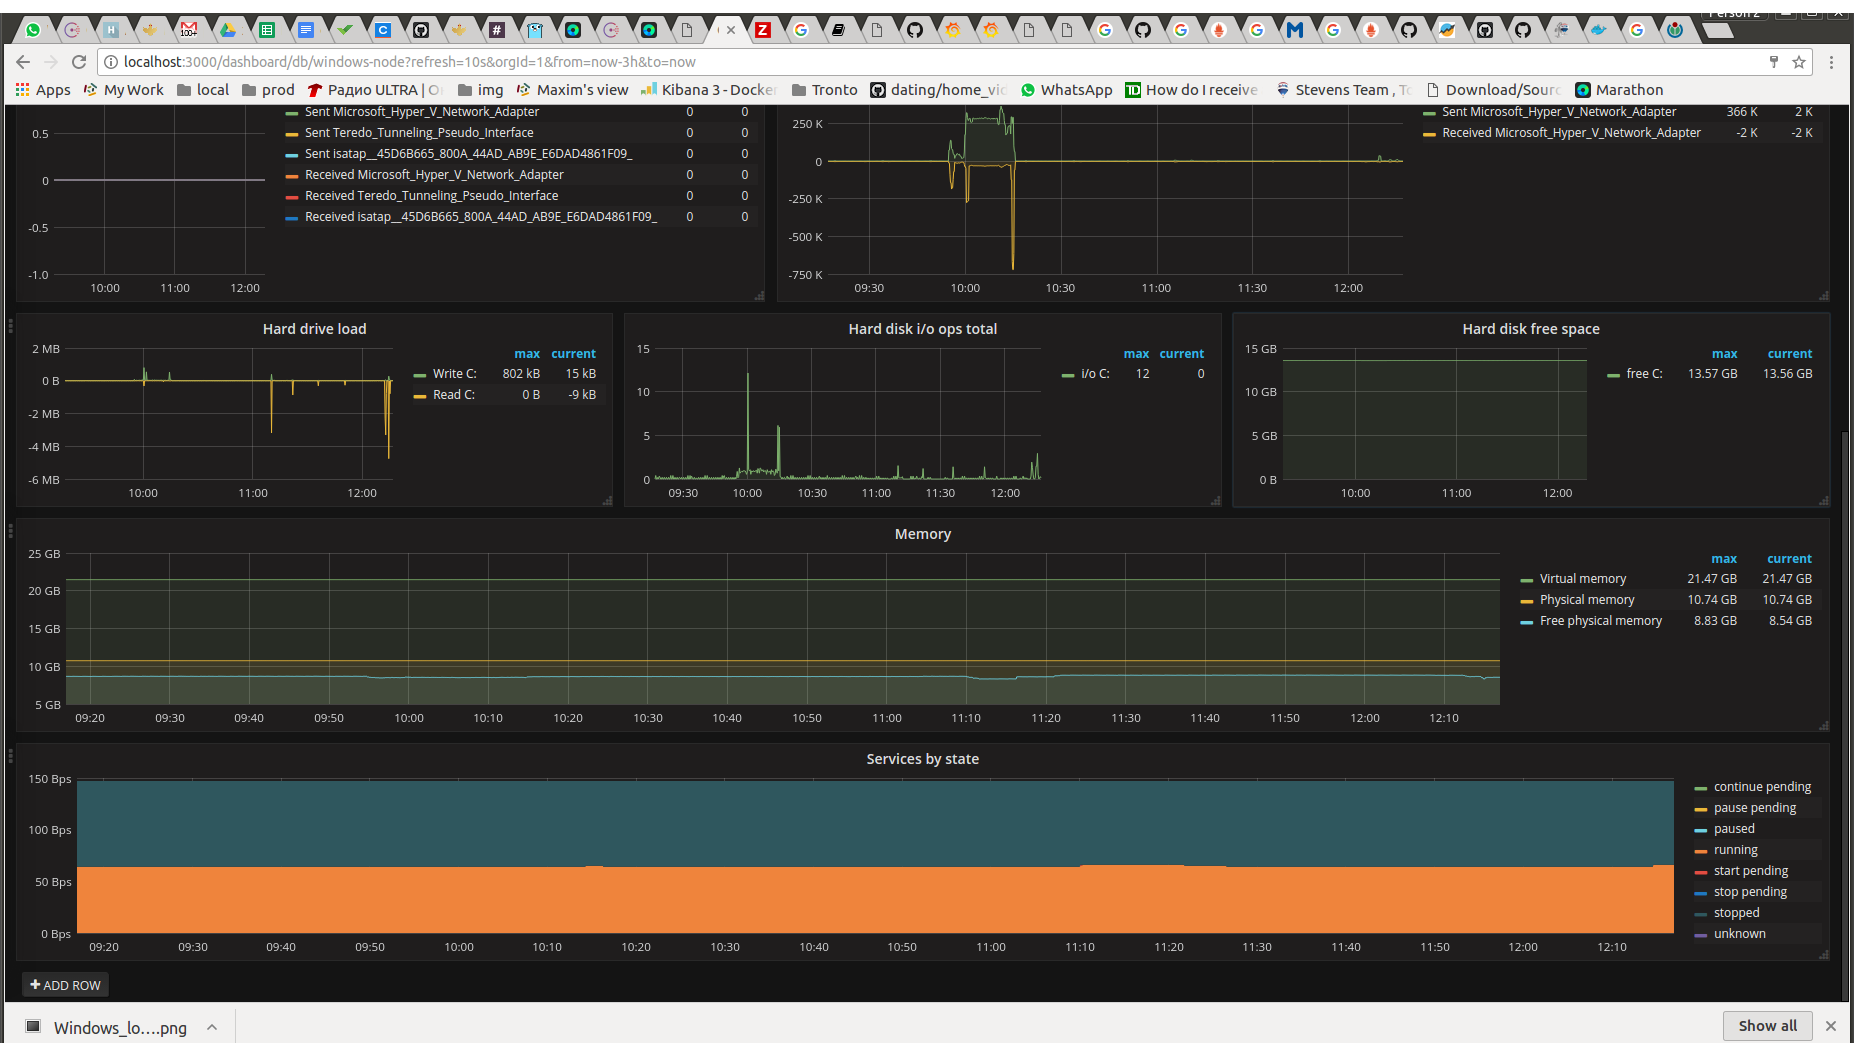
Windows Node
General stats dashboard with node selector, uses metrics from wmi_exporter
Uses metrics from https://github.com/martinlindhe/wmi_exporter
Features:
- Node selector
- Summary CPU load
- Memory stats
- Network load
- Hard disks usage
- Service state summary
Prometheus config:
  - job_name: 'win-exporter'
    static_configs:
      - targets: ['192.168.0.1:9182']
192.168.0.1 - Windows node where wmi_exporter is installed
Use ['192.168.0.1:9182', '192.168.0.2:9182'] for multiple hosts
Data source config
Collector type:
Collector plugins:
Collector config:
Dashboard revisions
Upload an updated version of an exported dashboard.json file from Grafana
| Revision | Decscription | Created | |
|---|---|---|---|
| Download |
Sign up for Grafana Cloud

Get up and running in minutes with the Grafana Cloud free tier, which includes free forever 10k metrics, 50GB logs, 50GB traces, 500 VUh, and more.
Get this dashboard
Data source:
Dependencies: