Node Exporter Summary
Infrastructure Monitoring Dashboard: Summary Server Dashboard
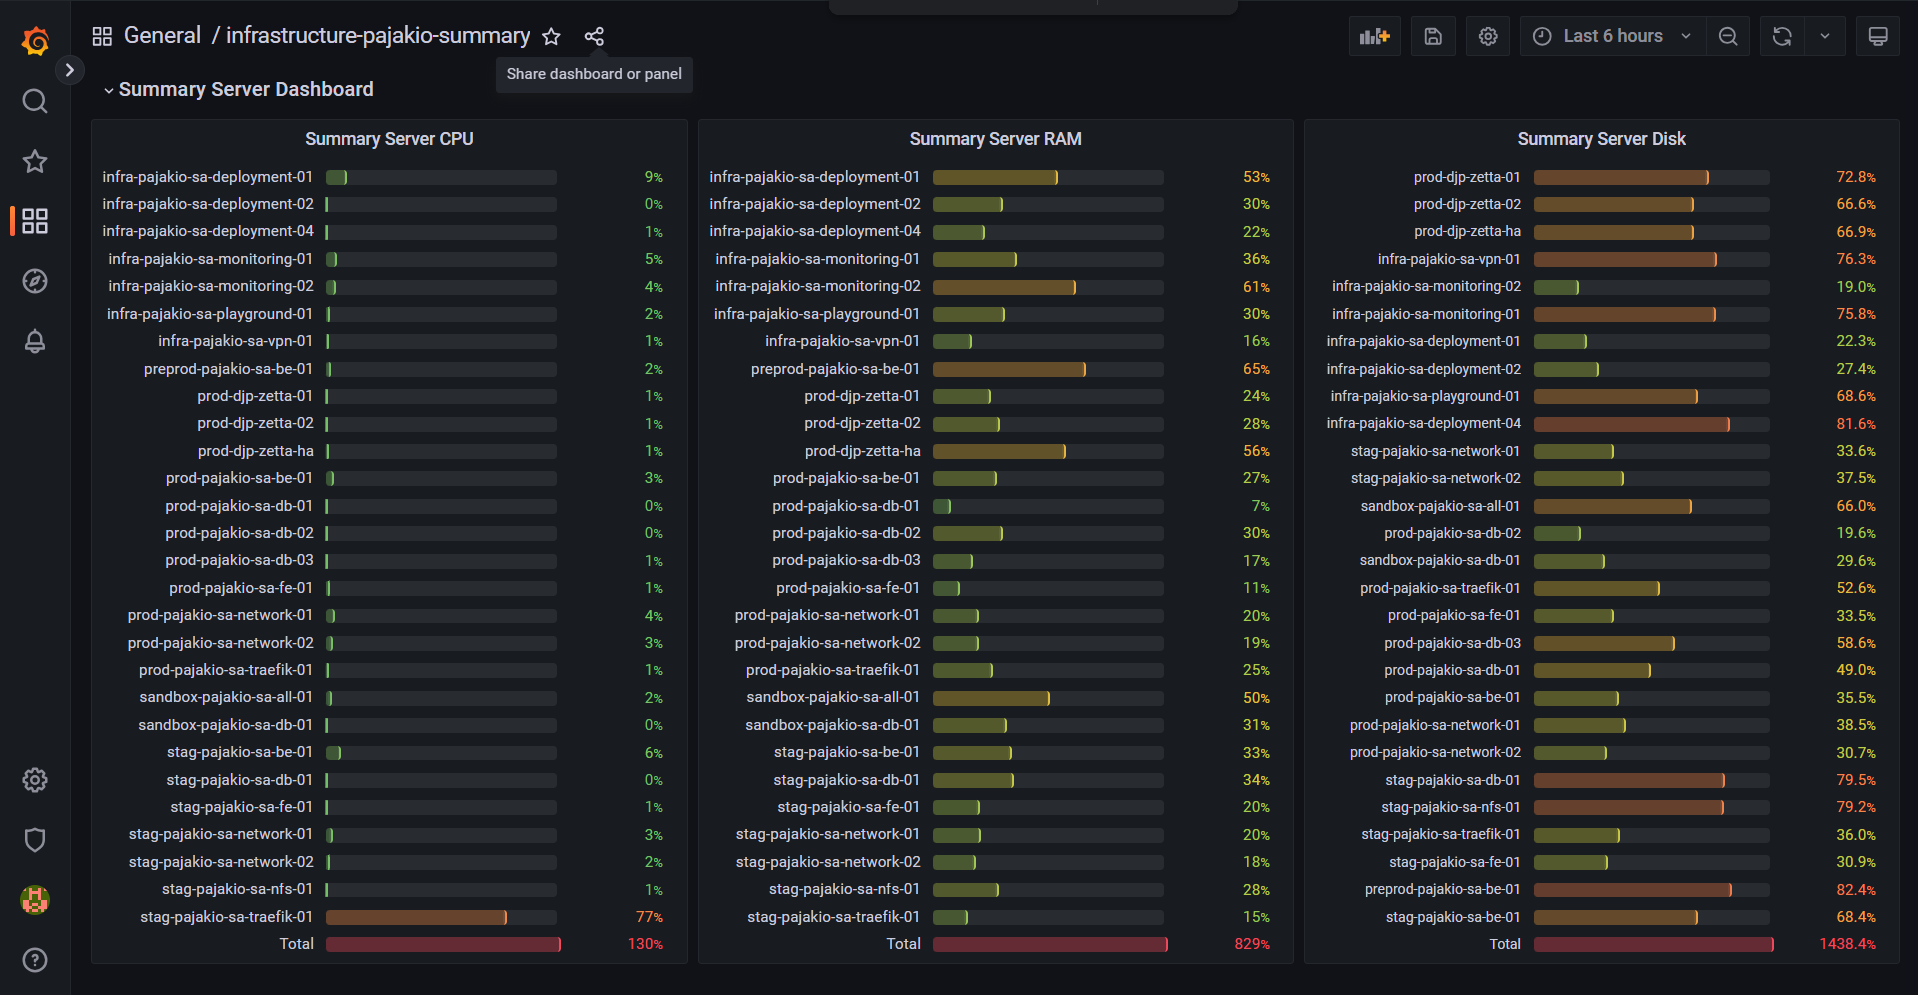
Infrastructure Monitoring Dashboard: Summary Server Dashboard
Follow me : https://github.com/strongpapazola
Overview
This dashboard provides a comprehensive summary of the server resource usage across our infrastructure. It is designed to give a clear and concise view of CPU, RAM, and Disk usage for each server, grouped by their respective jobs or roles within the infrastructure. The dashboard is divided into three main sections: CPU usage, RAM usage, and Disk usage.
Sections
Summary Server CPU
- Purpose: Displays the percentage of CPU usage for each server.
- Visualization: Bar Gauge
- Description: Each bar represents the CPU usage percentage of a specific server. This helps in identifying which servers are currently under heavy load or utilizing minimal CPU resources. The bar gauge is color-coded to quickly highlight servers with high CPU usage.
- Usage: Useful for identifying CPU bottlenecks and ensuring that CPU resources are efficiently utilized across the infrastructure.
Summary Server RAM
- Purpose: Displays the percentage of RAM usage for each server.
- Visualization: Bar Gauge
- Description: Each bar represents the RAM usage percentage of a specific server. This section helps in monitoring the memory usage and ensures that no server is running out of memory. The color-coded bars provide a quick visual indication of servers with high RAM usage.
- Usage: Essential for tracking memory utilization and preventing memory overcommitment or shortages, which can affect server performance.
Summary Server Disk
- Purpose: Displays the percentage of Disk usage for each server.
- Visualization: Bar Gauge
- Description: Each bar represents the Disk usage percentage of a specific server. This helps in monitoring the storage capacity and usage of each server, ensuring that there is enough disk space available and identifying servers that may require additional storage. The color coding highlights servers with high disk usage, facilitating quick identification of potential storage issues.
- Usage: Important for managing storage resources, preventing disk space shortages, and planning for future storage needs.
Features
- Real-Time Monitoring: The dashboard provides real-time updates, ensuring that the data displayed is current and accurate.
- Color-Coded Indicators: The bar gauges use color coding to highlight critical usage levels, making it easy to spot servers with high resource usage at a glance.
- Grouped by Job: Servers are grouped by their job or role within the infrastructure, providing context and helping in understanding resource usage patterns.
Benefits
- Efficient Resource Management: Helps in ensuring that CPU, RAM, and Disk resources are effectively utilized across the infrastructure.
- Quick Identification of Issues: Color-coded bar gauges make it easy to identify servers that are under heavy load or running low on resources.
- Proactive Monitoring: Enables proactive monitoring and management of server resources, preventing potential performance issues or outages.
Usage Instructions
- CPU Usage Monitoring: Keep an eye on the "Summary Server CPU" section to identify servers with high CPU usage and take necessary actions such as load balancing or scaling.
- RAM Usage Monitoring: Monitor the "Summary Server RAM" section to ensure that all servers have sufficient memory available and address any memory shortages.
- Disk Usage Monitoring: Regularly check the "Summary Server Disk" section to manage storage resources and plan for additional storage if needed.
This dashboard is an essential tool for maintaining optimal server performance and ensuring that our infrastructure runs smoothly and efficiently. It provides a quick and clear overview of resource usage, enabling effective resource management and proactive issue resolution.
Data source config
Collector config:
Upload an updated version of an exported dashboard.json file from Grafana
| Revision | Description | Created | |
|---|---|---|---|
| Download |
Linux Server
Monitor Linux with Grafana. Easily monitor your Linux deployment with Grafana Cloud's out-of-the-box monitoring solution.
Learn more