Celestia Bridge Node v2
System for monitoring custom metrics for a bridge node using Prometheus and Node Exporter. Node Exporter is a powerful tool that collects operating system and hardware metrics from servers and can also be extended to expose custom metrics.
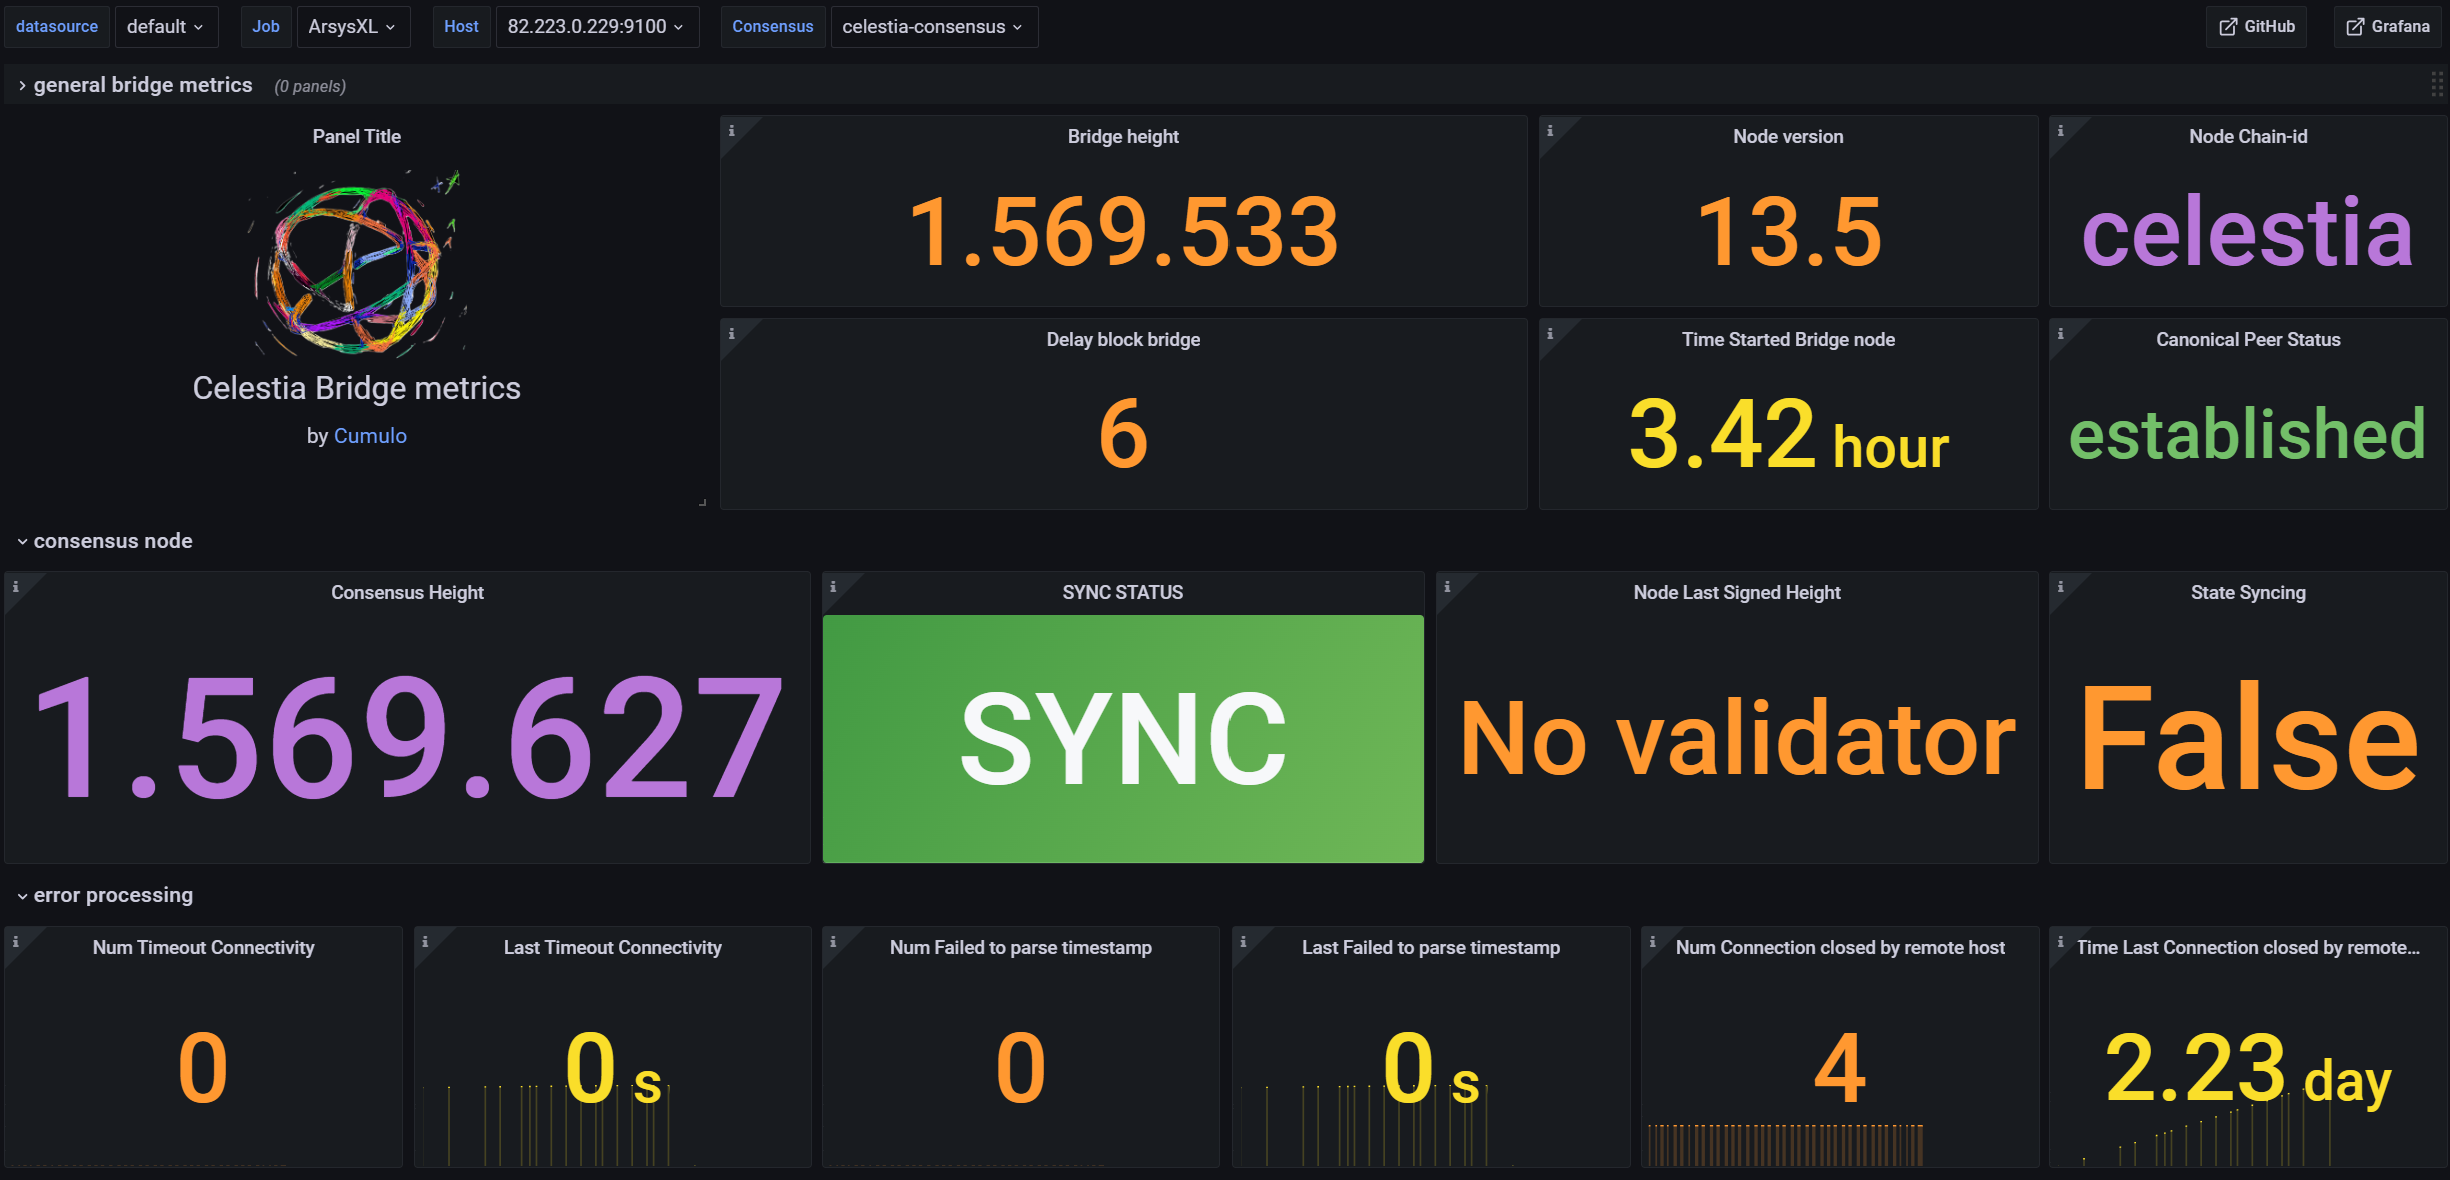
The Celestia Bridge Node v2 dashboard uses the __expr__ and prometheus data sources to create a Grafana dashboard with the gauge, stat, text and timeseries panels.
Data source config
Collector type:
Collector plugins:
Collector config:
Revisions
Upload an updated version of an exported dashboard.json file from Grafana
| Revision | Description | Created | |
|---|---|---|---|
| Download |
Linux Server
Monitor Linux with Grafana. Easily monitor your Linux deployment with Grafana Cloud's out-of-the-box monitoring solution.
Learn more