Hystrix Dashboard
Dashboard to monitor key metrics for Hystrix. The Hystrix metrics are published using Prometheus' simpleclient through this library https://github.com/soundcloud/prometheus-hystrix
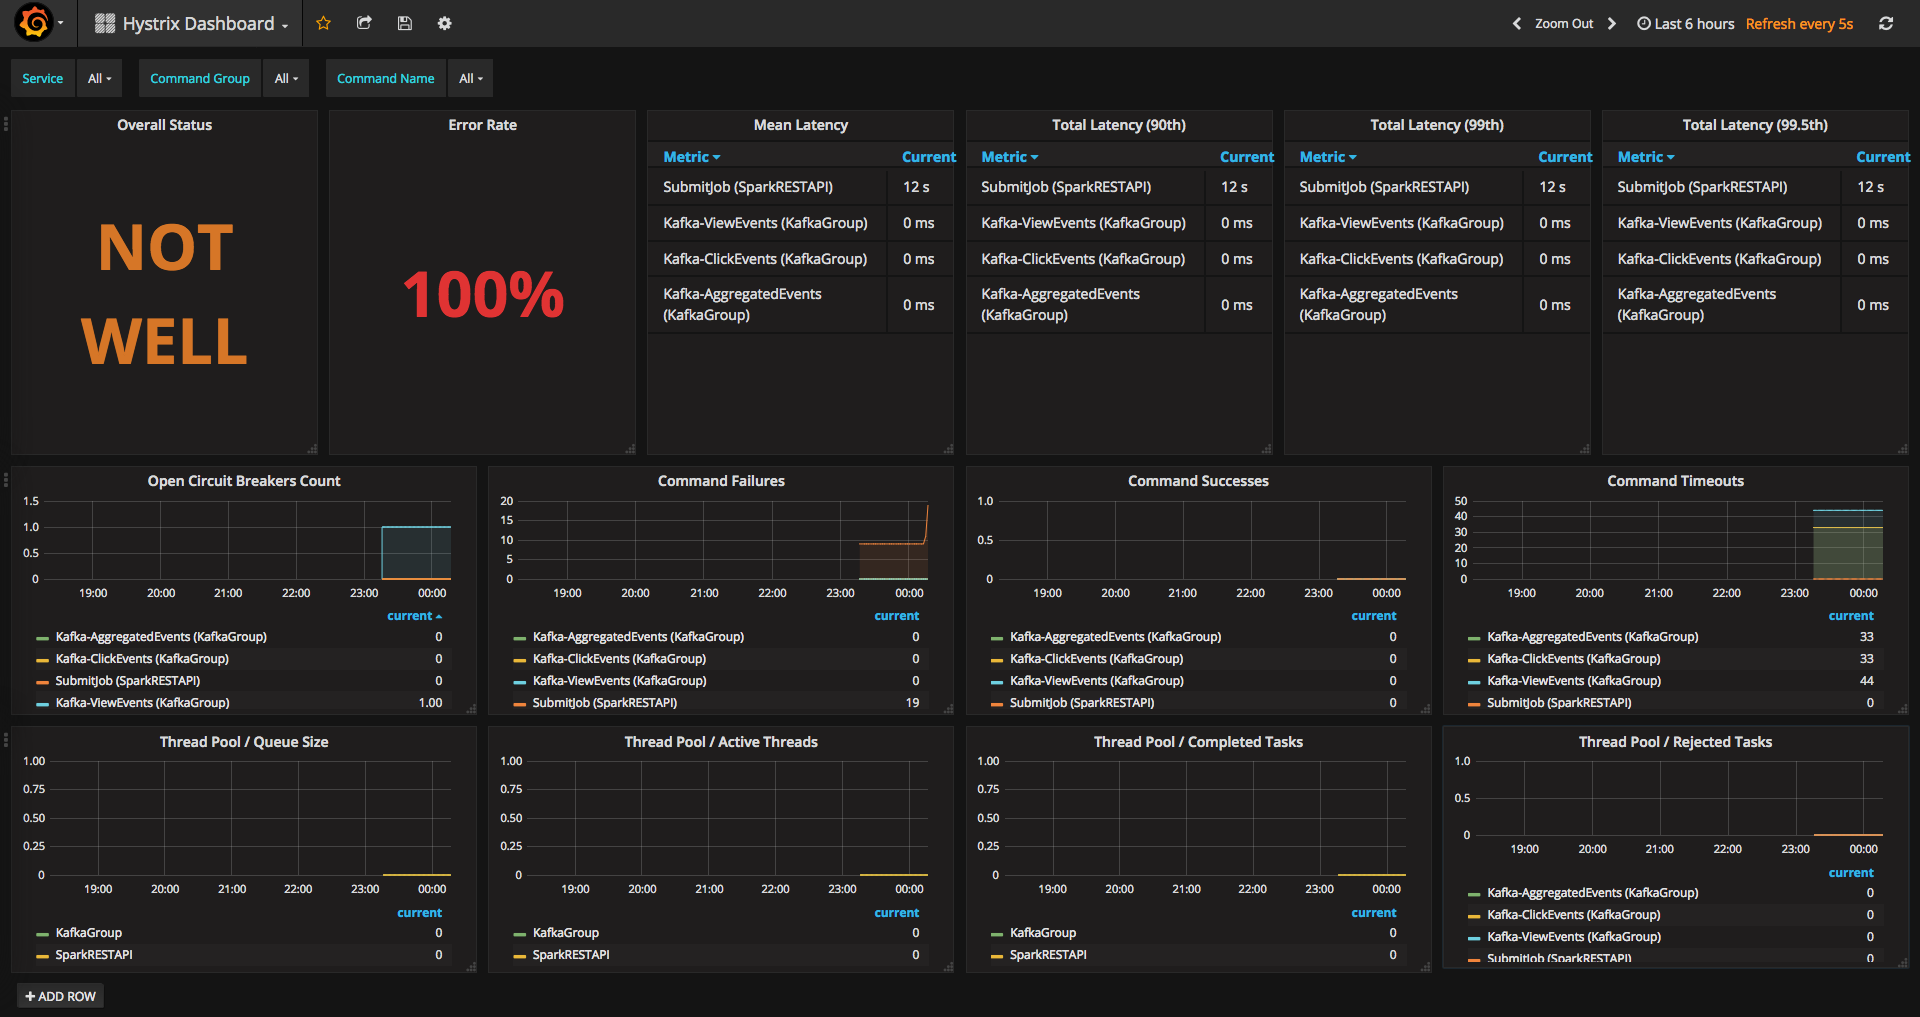
The Hystrix Dashboard dashboard uses the prometheus data source to create a Grafana dashboard with the graph, singlestat and table panels.
Data source config
Collector type:
Collector plugins:
Collector config:
Revisions
Upload an updated version of an exported dashboard.json file from Grafana
| Revision | Description | Created | |
|---|---|---|---|
| Download |