
KronosBoard
This Grafana dashboard provides insights into the resource scheduling of resources within each namespace in your Kubernetes cluster.

Kronos Kubernetes Operator Grafana Dashboard
Welcome to the Grafana dashboard for the Kronos Kubernetes Operator! This dashboard provides a comprehensive view of both controller metrics and additional metrics exposed by the custom controller, offering valuable insights into the performance and status of your Kubernetes resources managed by Kronos.
Dashboard Overview
This dashboard consists of two main sections:
- Controller Metrics
- Custom Controller Metrics
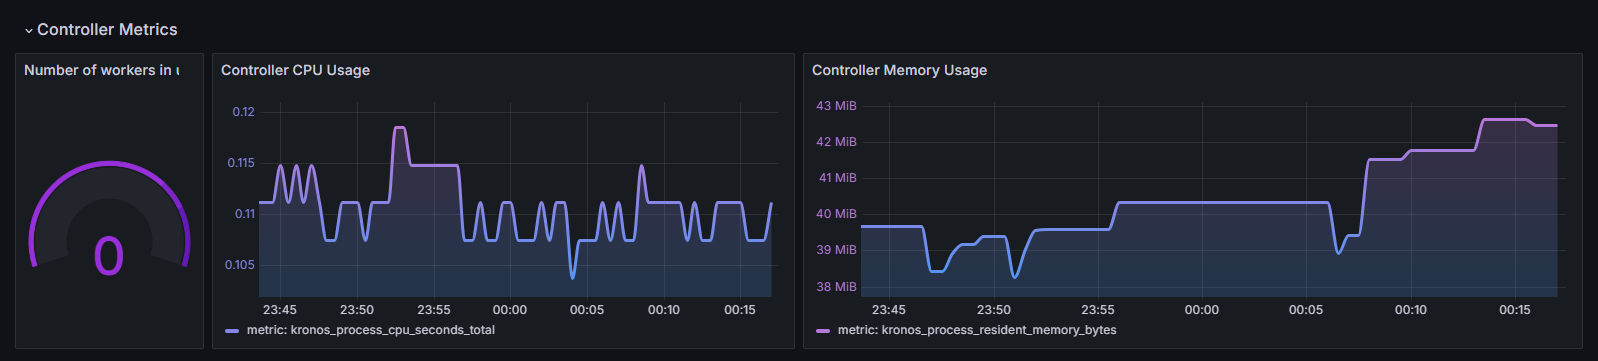
1. Controller Metrics
The controller metrics section provides insights into the resource consumption of your Kubernetes cluster. These metrics include:
- CPU Usage: Displays the CPU consumption of the controller.
- Memory Usage: Shows the memory usage of the controller.
- Number of Workers: Indicates the number of active workers.
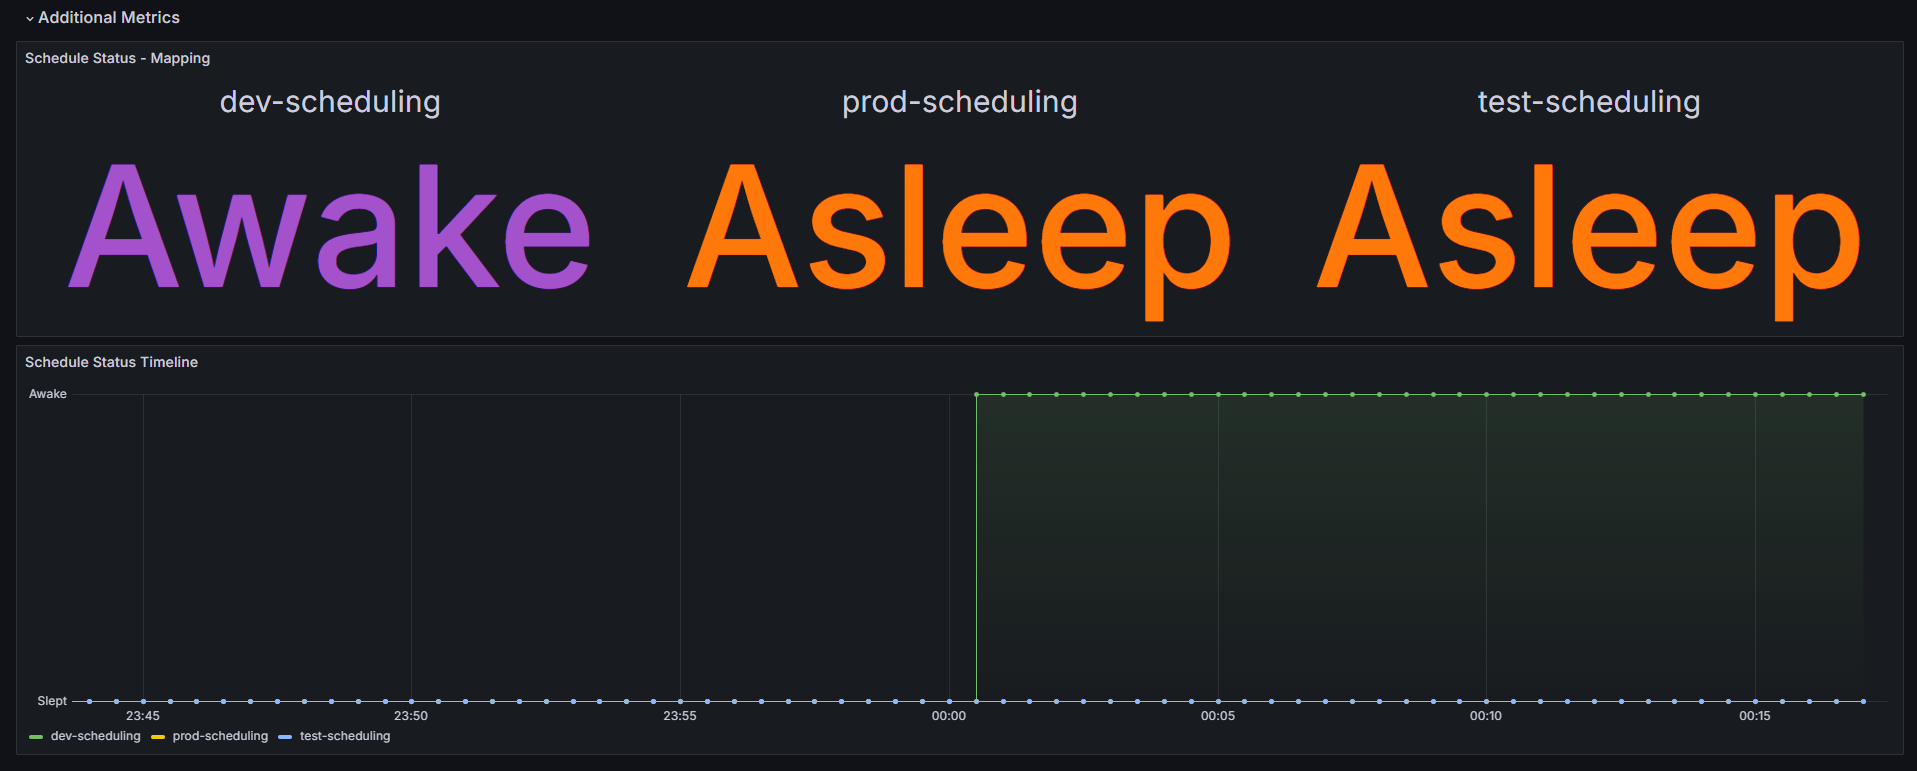
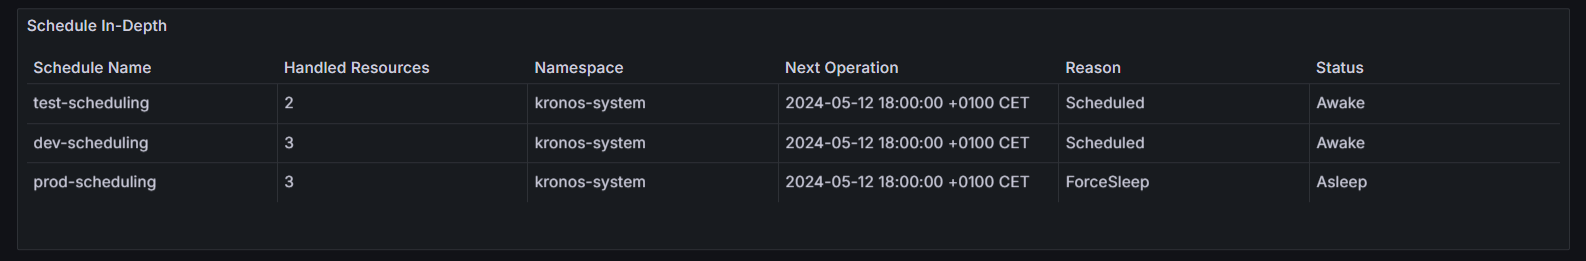
2. Custom Controller Metrics
The custom controller metrics section includes specific metrics exposed by the Kronos operator, offering detailed information about the status and operations of the KronosApp custom resource. The primary metrics include:
- schedule_info: Provides information about the scheduling status of each KronosApp custom resource.
- indepth_schedule_info: Gives detailed insights into the status, reason, next operation, and handled resources for each KronosApp custom resource.
Metric Prefix Requirement
For this dashboard to function correctly, all metrics must be prefixed with kronos_. This ensures that the metrics are correctly identified and displayed within the Grafana dashboard.
Configuration Examples
To configure Prometheus to scrape the metrics with the required prefix, you can use either a simple Prometheus job configuration or a ServiceMonitor configuration for the Prometheus Operator.
Simple Prometheus Job Configuration
- job_name: 'kronos'
  scheme: https
  bearer_token_file: /var/run/secrets/kubernetes.io/serviceaccount/token
  tls_config:
    insecure_skip_verify: true
  kubernetes_sd_configs:
    - role: service
  relabel_configs:
    - source_labels: [__meta_kubernetes_service_name]
      action: keep
      regex: kronos-controller-manager-metrics-service
  metric_relabel_configs:
    - source_labels: [__name__]
      regex: (.*)
      replacement: kronos_$1
      target_label: __name__
ServiceMonitor Configuration for Prometheus Operator
apiVersion: monitoring.coreos.com/v1
kind: ServiceMonitor
metadata:
  labels:
    app: kronos
    control-plane: controller-manager
  name: kronos-controller-manager-metrics-monitor
  namespace: kronos-system
spec:
  endpoints:
  - bearerTokenFile: /var/run/secrets/kubernetes.io/serviceaccount/token
    metricRelabelings:
    - action: replace
      regex: (.*)
      replacement: kronos_$1
      sourceLabels:
      - __name__
      targetLabel: __name__
    path: /metrics
    port: https
    scheme: https
    tlsConfig:
      insecureSkipVerify: true
  selector:
    matchLabels:
      control-plane: controller-manager
Note: The ServiceMonitor custom resource definition (CRD) is included as part of the Kronos Helm chart and the basic Kronos distribution file. For more information on installing and configuring Kronos, please consult the installation page.
Setup Instructions
- Import the Dashboard: Use the provided JSON file to import the dashboard into your Grafana instance.
- Configure Data Source: Ensure your Prometheus data source is correctly configured to scrape metrics from your Kubernetes cluster.
- Verify Metric Prefix: Confirm that all metrics exposed by the Kronos operator are prefixed with
kronos_.
Additional Information
- Documentation: For more detailed information on the Kronos operator and its metrics, please refer to the official Kronos documentation.
- Support: If you encounter any issues or have questions, feel free to open an issue on our GitHub repository.
Contributing
We welcome contributions to improve this dashboard. If you have suggestions or enhancements, please open an issue on our GitHub repository.
Thank you for using the Kronos Kubernetes Operator Grafana Dashboard! We hope this tool helps you effectively monitor and manage your Kubernetes resources.
Data source config
Collector config:
Upload an updated version of an exported dashboard.json file from Grafana
| Revision | Description | Created | |
|---|---|---|---|
| Download |