JMeter Performance Dashboard
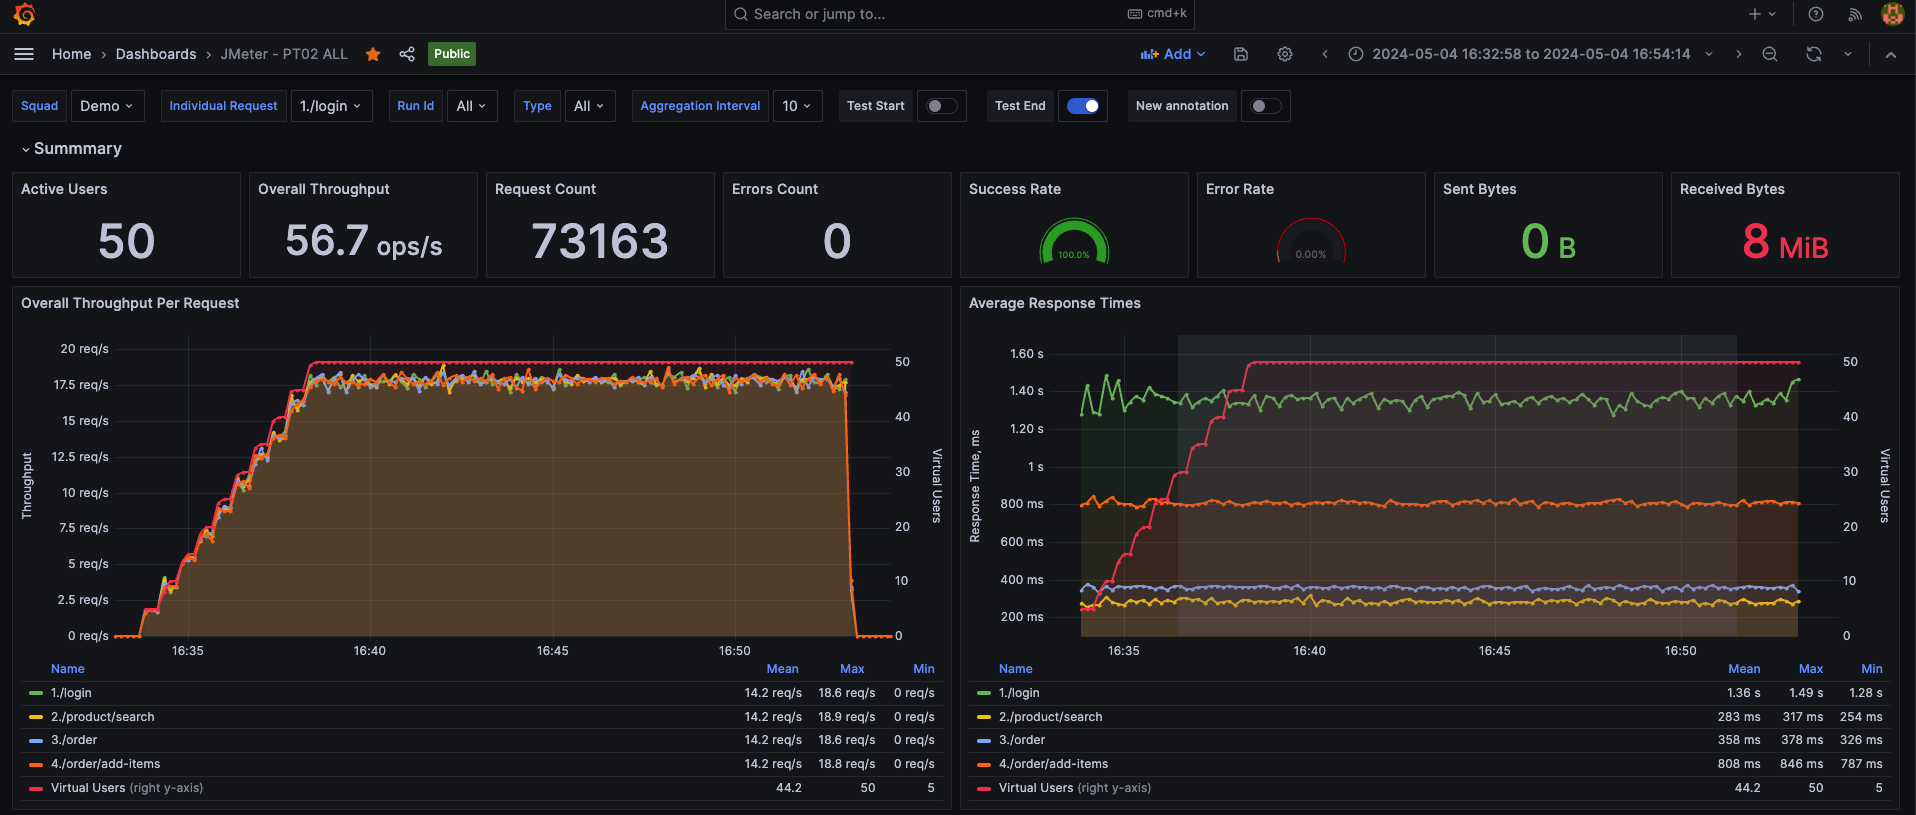
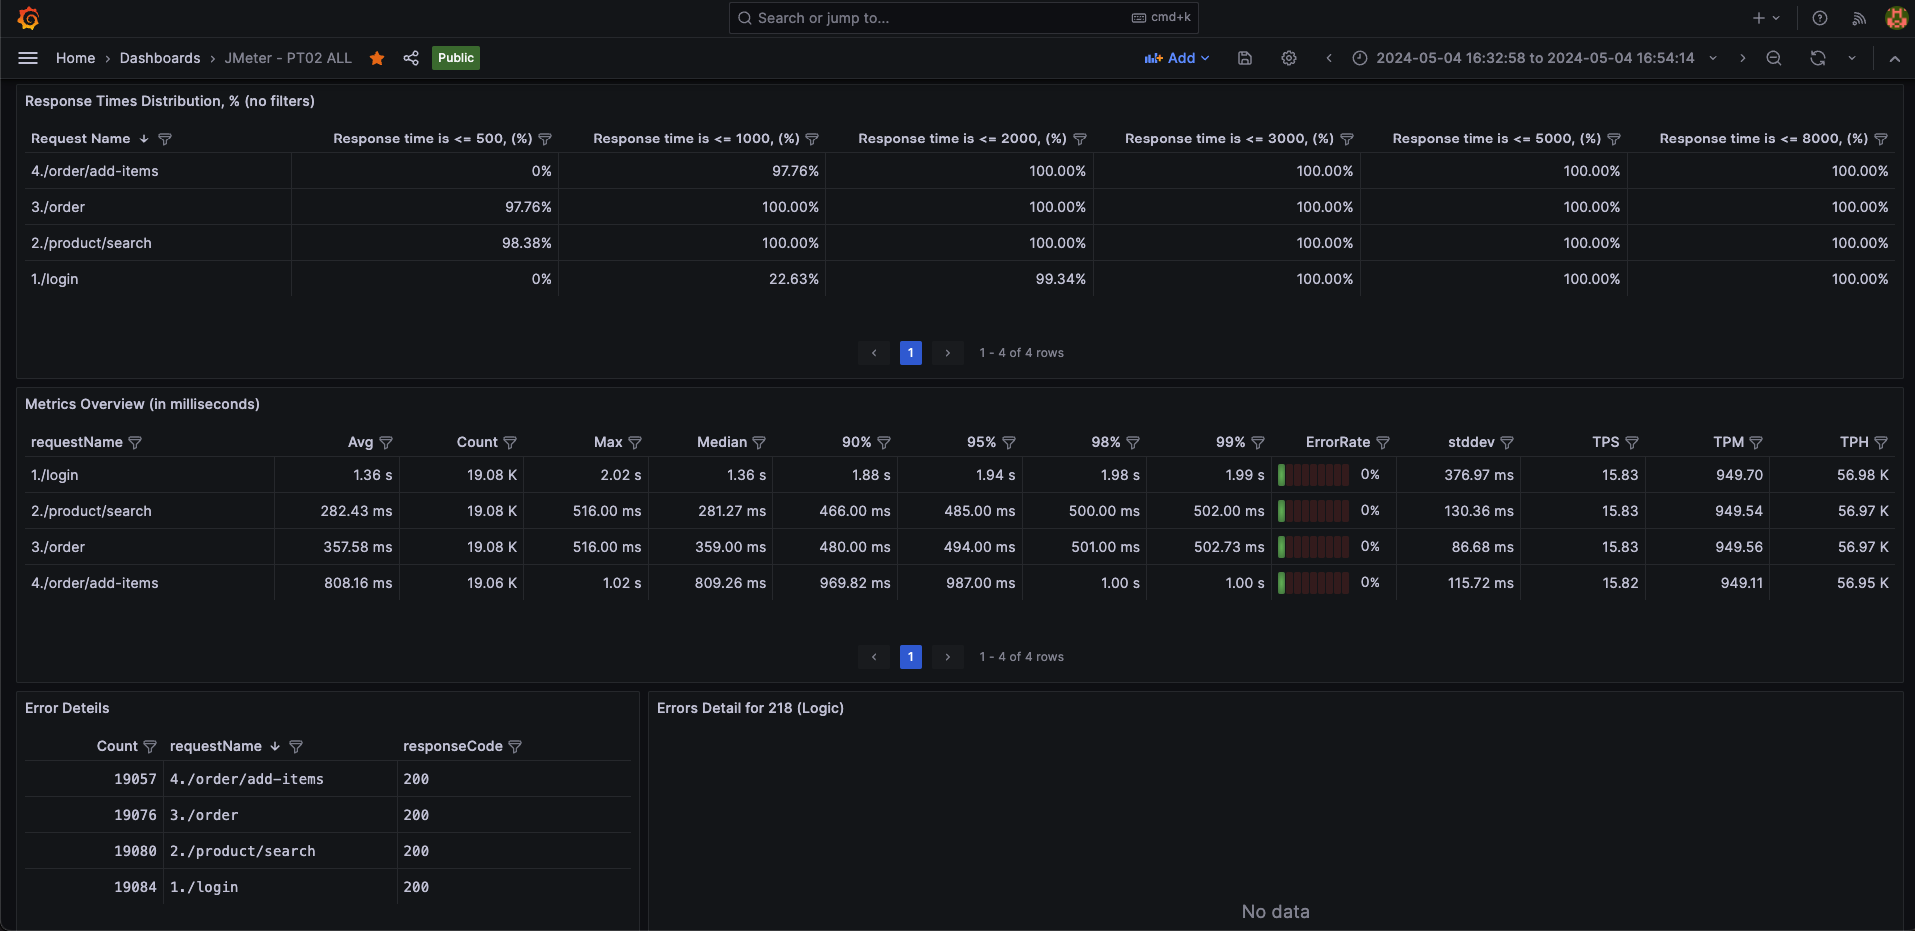
This dashboard includes updated bar charts, real-time load test metrics from JMeter, and support for tracking errors (percentage or number) in conjunction with logic failure requests.
This dashboard includes updated bar charts, real-time load test metrics from JMeter, and support for tracking errors (percentage or number) in conjunction with logic failure requests.
It contains:
Summary report: The Activated Users, Total Request, Success/Error Rate, Throughput, and Response Time; We have added the feature of statistics on the number (percentage) of requests with each specific time point and statistics on the number of logic errors (errors that do not return the correct response data as we expected), and error messages are also displayed directly.
Basic Metrics for Performance: Throughput, Response Time, Network, etc.
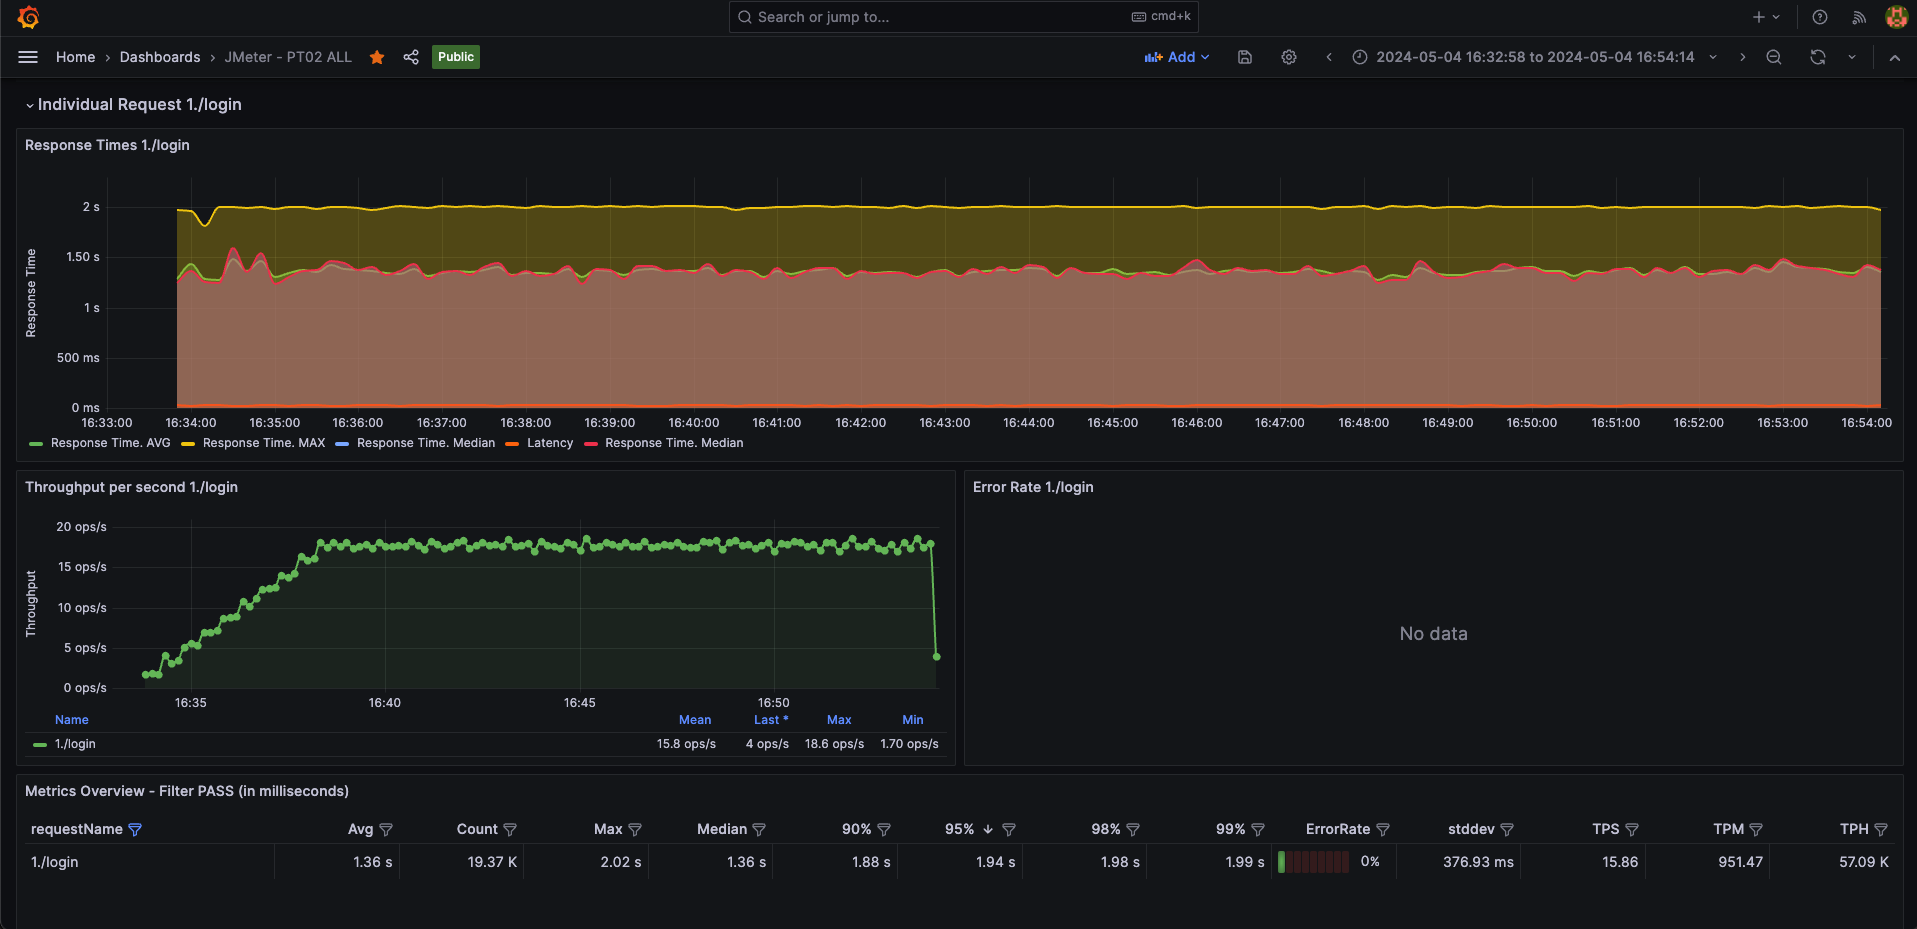
Added an individual report for a request: We support you to track information directly for any APIs
Added many dynamic configurations: DataSource: You can choose the dynamic datasource (View real time any data source in testing)
Data source config
Collector config:
Upload an updated version of an exported dashboard.json file from Grafana
| Revision | Description | Created | |
|---|---|---|---|
| Download |


