
Raid (mdadm)
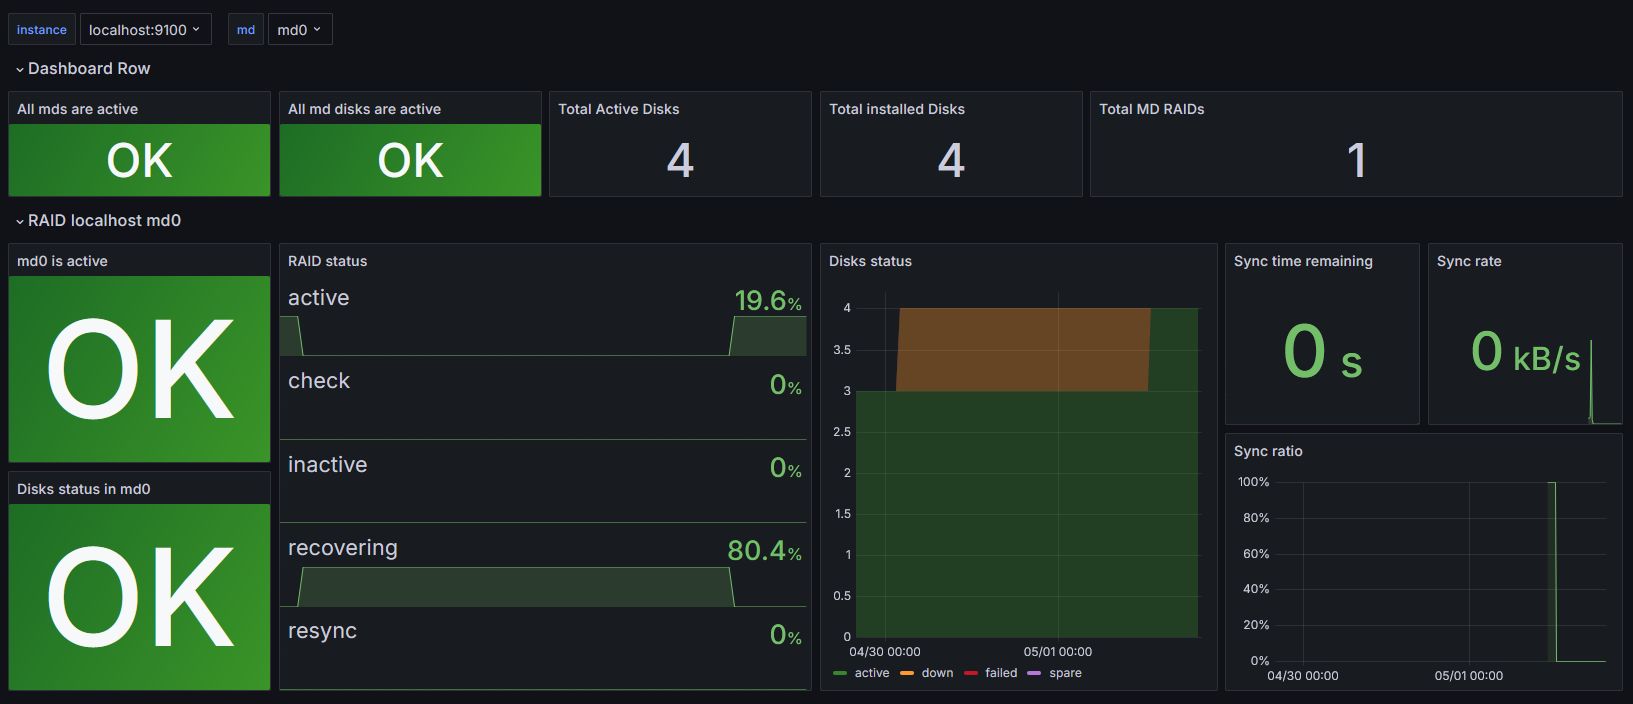
Prometheus node_exporter mdadm module dashboard. Per Server and per md view
Improved version of an existing board. See blow for details.
ATTENTION: This board needs a yet-as-of-now-to-be-merged version of node_exporter (see below)!
Changes to the board: (Original: https://grafana.com/grafana/dashboards/12768-victoria-mdadm/)
- improved layout to see history of raid status
- changed raid status to show as percentage
- added disk status history graph
- added sync time remaining
- added sync rate
- replaced deprecated angular graph with new time series graph
Changes to node_explorer: (PR: https://github.com/prometheus/node_exporter/pull/3007)
Added missing mdadm stats:
node_md_disks# added{state="down"}node_md_sync_time_remaining(seconds)node_md_blocks_synced_speedUPDATE: renamed tonode_md_sync_time_remaining_secondsnode_md_blocks_synced_pctUPDATE: renamed tonode_md_blocks_synced_percent
Notes:
- One drive was not being shown, as it was in
state="down"(recovering), which was not reported in the output. - Using
node_md_blocks_synced / node_md_blocksas progress percentage created wrong results on my system, as the total-blocks differed from the total-to-be-synced-blocks. This may be due to the raid-level being used (raid5).
md0 : active raid5 sdf1[4] sde1[1] sdc1[2] sdb1[0]
      14650718208 blocks super 1.2 level 5, 512k chunk, algorithm 2 [4/3] [UUU_]
      [===================>.]  recovery = 99.9% (4882207424/4883572736) finish=7.8min speed=2908K/sec
      bitmap: 2/37 pages [8KB], 65536KB chunk
Data source config
Collector type:
Collector plugins:
Collector config:
Revisions
Upload an updated version of an exported dashboard.json file from Grafana
| Revision | Description | Created | |
|---|---|---|---|
| Download |