Platform Engineer Dashboard
APIs
Platform Engineer Dashboard (Kuadrant)
Short Description
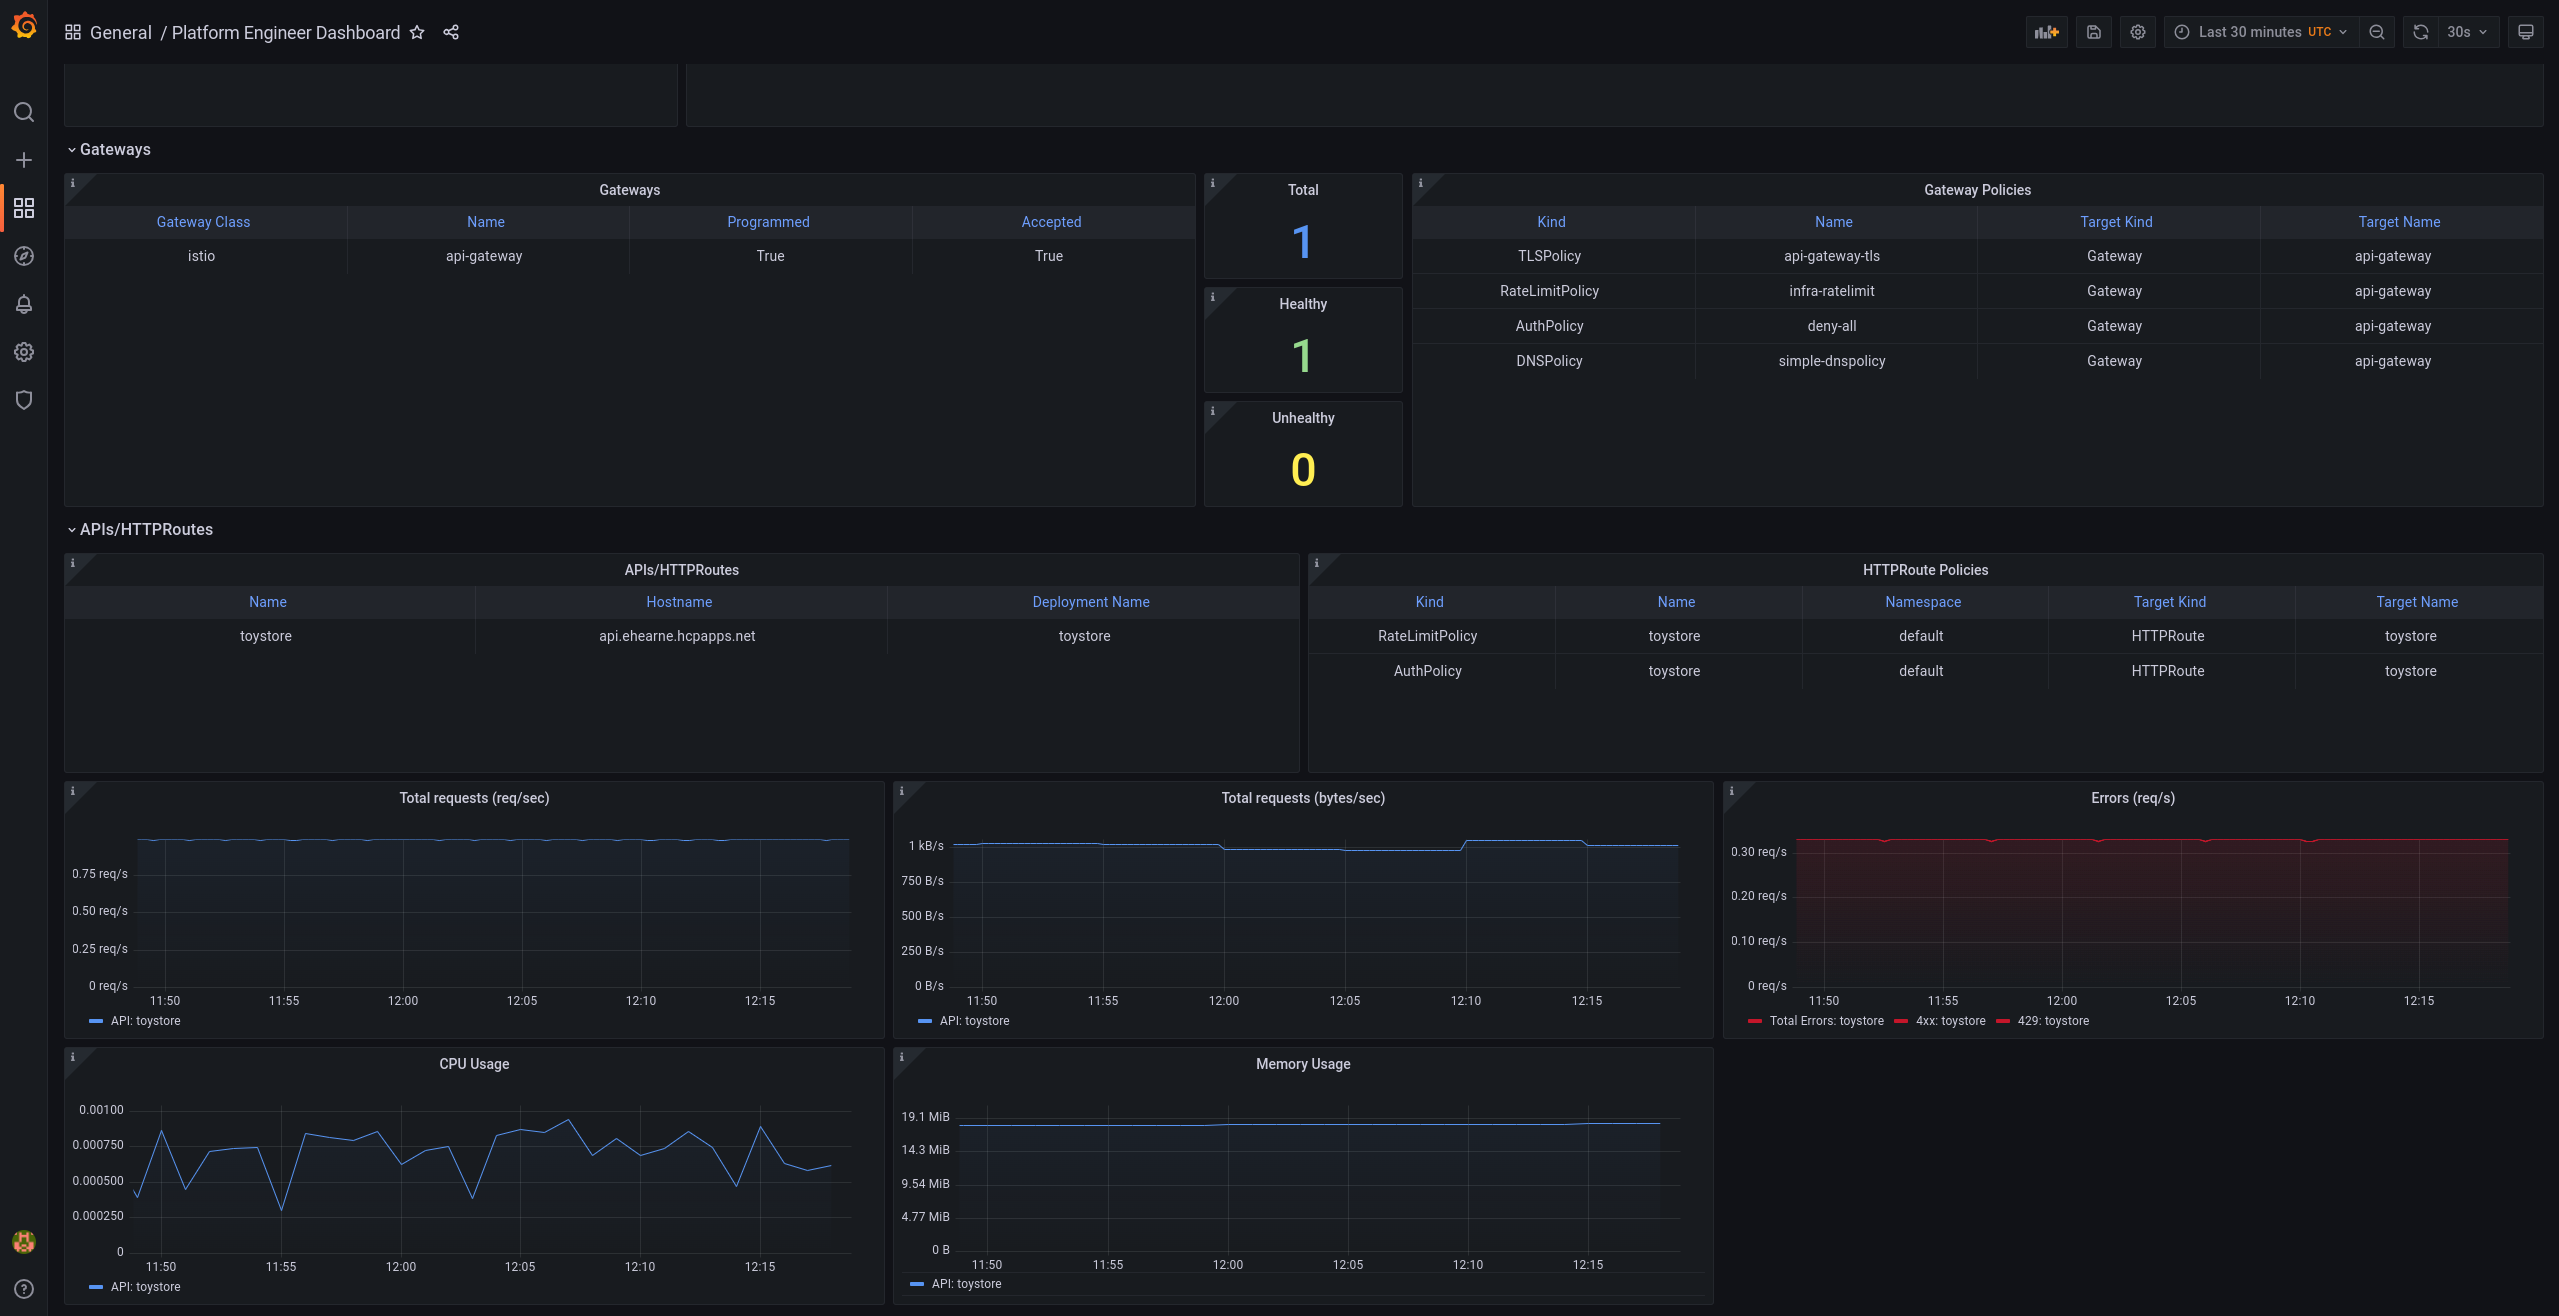
This dashboard is ideal for a platform engineer as it goes in-depth into the infrastructure of a system. It shows information on gateways, and APIs.
The dashboard shows information on what gateways are being used, which gateways are unhealthy, and policies relating to the gateways being used. At a glance, the platform engineer can see the policies and gateways in place and can quickly make adjustments from this information if needed.
The dashboard also lists what APIs are in use, as well as what API policies are in place and where they are in use. Metrics can also be viewed below on requests being made, errors from the API, as well as resources utilised by the system. This can be useful for the engineer to see for how long the system has been affected by a shutdown, or for how long resource utilisation has been higher or lower than normal, and can quickly make adjustments from this context.
Overview of Gateways, Policies and APIs
The panels below are grouped by Gateways and APIs. A Gateway is a Gateway API defined gateway resource. An API is realised by a Gateway API HTTPRoute. Any policies attached to the Gateways and APIs will be shown, as well as summary request and error metrics for APIs.
Important: HTTPRoutes must include a "service" and "deployment" label with a value that matches the name of the service & deployment being routed to. eg. "service=myapp, deployment=myapp"
Data source config
Collector config:
Upload an updated version of an exported dashboard.json file from Grafana
| Revision | Description | Created | |
|---|---|---|---|
| Download |

