Business User Dashboard
Business User Dashboard (Kuadrant)
Short Description
This dashboard is ideal for a business who may wish to check metrics on potential customer traffic, and where exactly these potential customers are visiting on their site.
It breaks down these metrics by how many requests to their site are made per second, but also where the requests are being made. It can also show when requests are least made during a given time period, and shows an exact number of requests made to a given path, and the change in traffic be it an increase or a decrease.
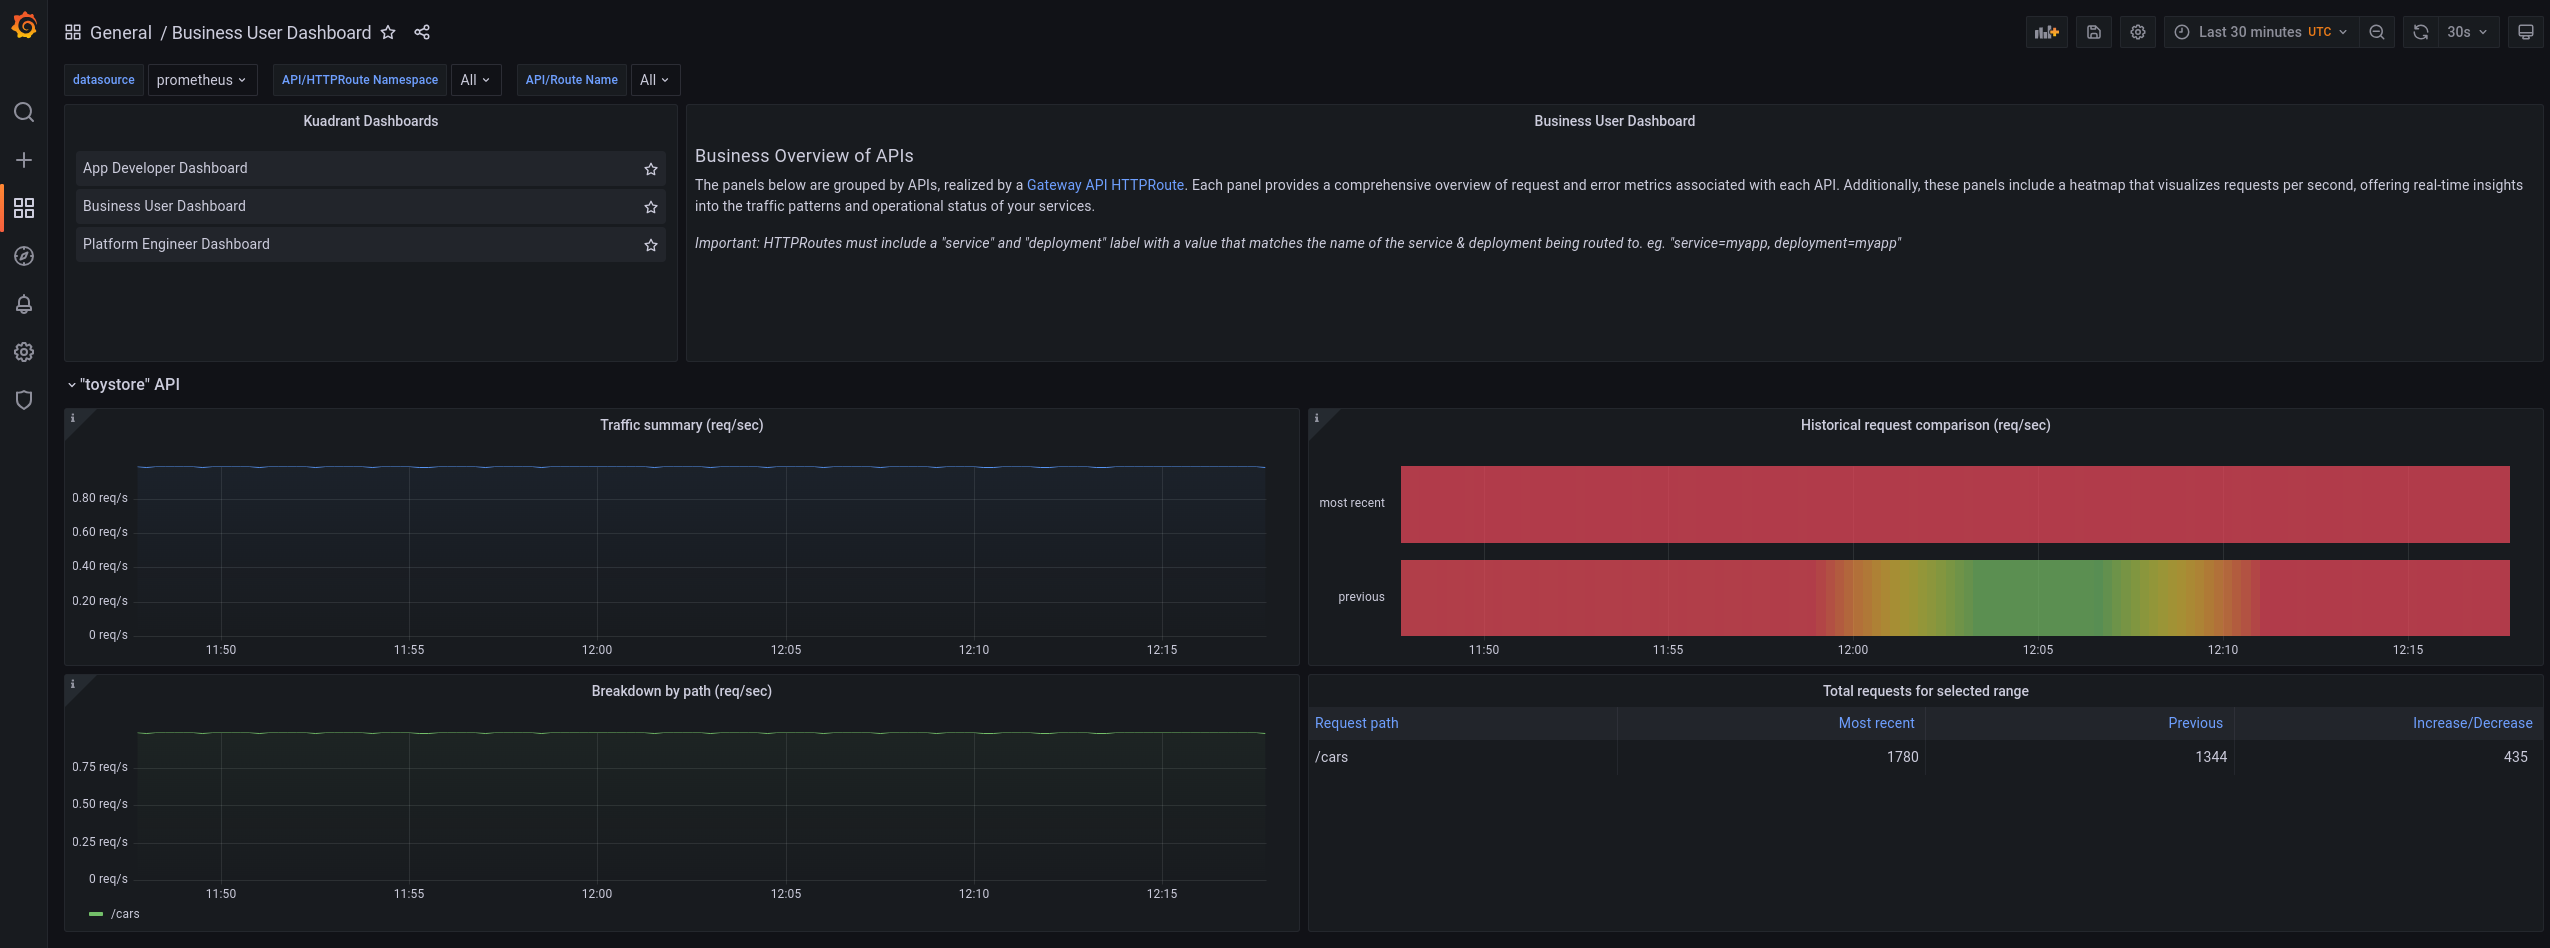
Business Overview of APIs
The panels below are grouped by APIs, realized by a Gateway API HTTPRoute. Each panel provides a comprehensive overview of request and error metrics associated with each API. Additionally, these panels include a heatmap that visualizes requests per second, offering real-time insights into the traffic patterns and operational status of your services.
Important: HTTPRoutes must include a "service" and "deployment" label with a value that matches the name of the service & deployment being routed to. eg. "service=myapp, deployment=myapp"
Data source config
Collector config:
Upload an updated version of an exported dashboard.json file from Grafana
| Revision | Description | Created | |
|---|---|---|---|
| Download |