Libvirt / OpenStack - VMs - Individual
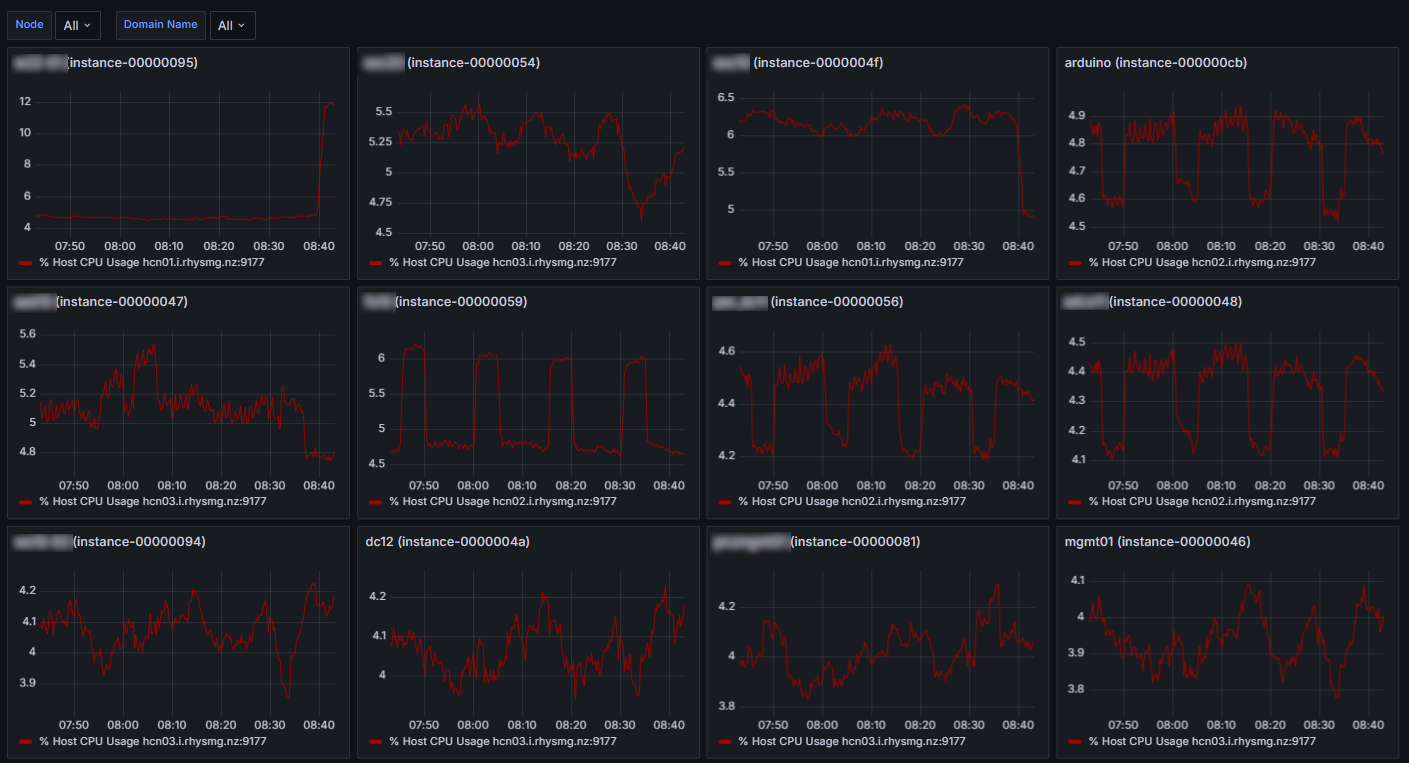
Repeating Individual time series charts showing % of host CPU time for multiple libvirt instances which are being managed by OpenStack Nova
An initial libvirt dashboard. So far just showing % of physical host CPU time, one time series chart per VM. I’m not 100% sure I’ve got it right but the numbers line up with top.
These are sorted by highest CPU first however this only updates when the variables are re-evaluated (i.e. browser refresh).
- This dashboard relies on the libvirt exporter: https://github.com/Tinkoff/libvirt-exporter.
- Tested on Ubuntu 22.04 running in docker as per: https://hub.docker.com/r/alekseizakharov/libvirt-exporter.
- It also relies on node exporter, to get the number of physical cores in the host.
This exporter exports details about the libvirt VMs including OpenStack Nova metadata. But it could easily be modified for non-nova environments. I hope to add a few more to this in the future.
Disclaimer: total Prometheus/Grafana newbie.
See Also: https://grafana.com/grafana/dashboards/20969-vms-combined-1/
Data source config
Collector config:
Upload an updated version of an exported dashboard.json file from Grafana
| Revision | Description | Created | |
|---|---|---|---|
| Download |
OpenStack
Easily monitor OpenStack, a collection of open source cloud infrastructure components, with Grafana Cloud's out-of-the-box monitoring solution.
Learn more
