DORA Metrics
Used with prometheus compatible dora-exporter. Find more on https://github.com/mprokopov/dora-exporter
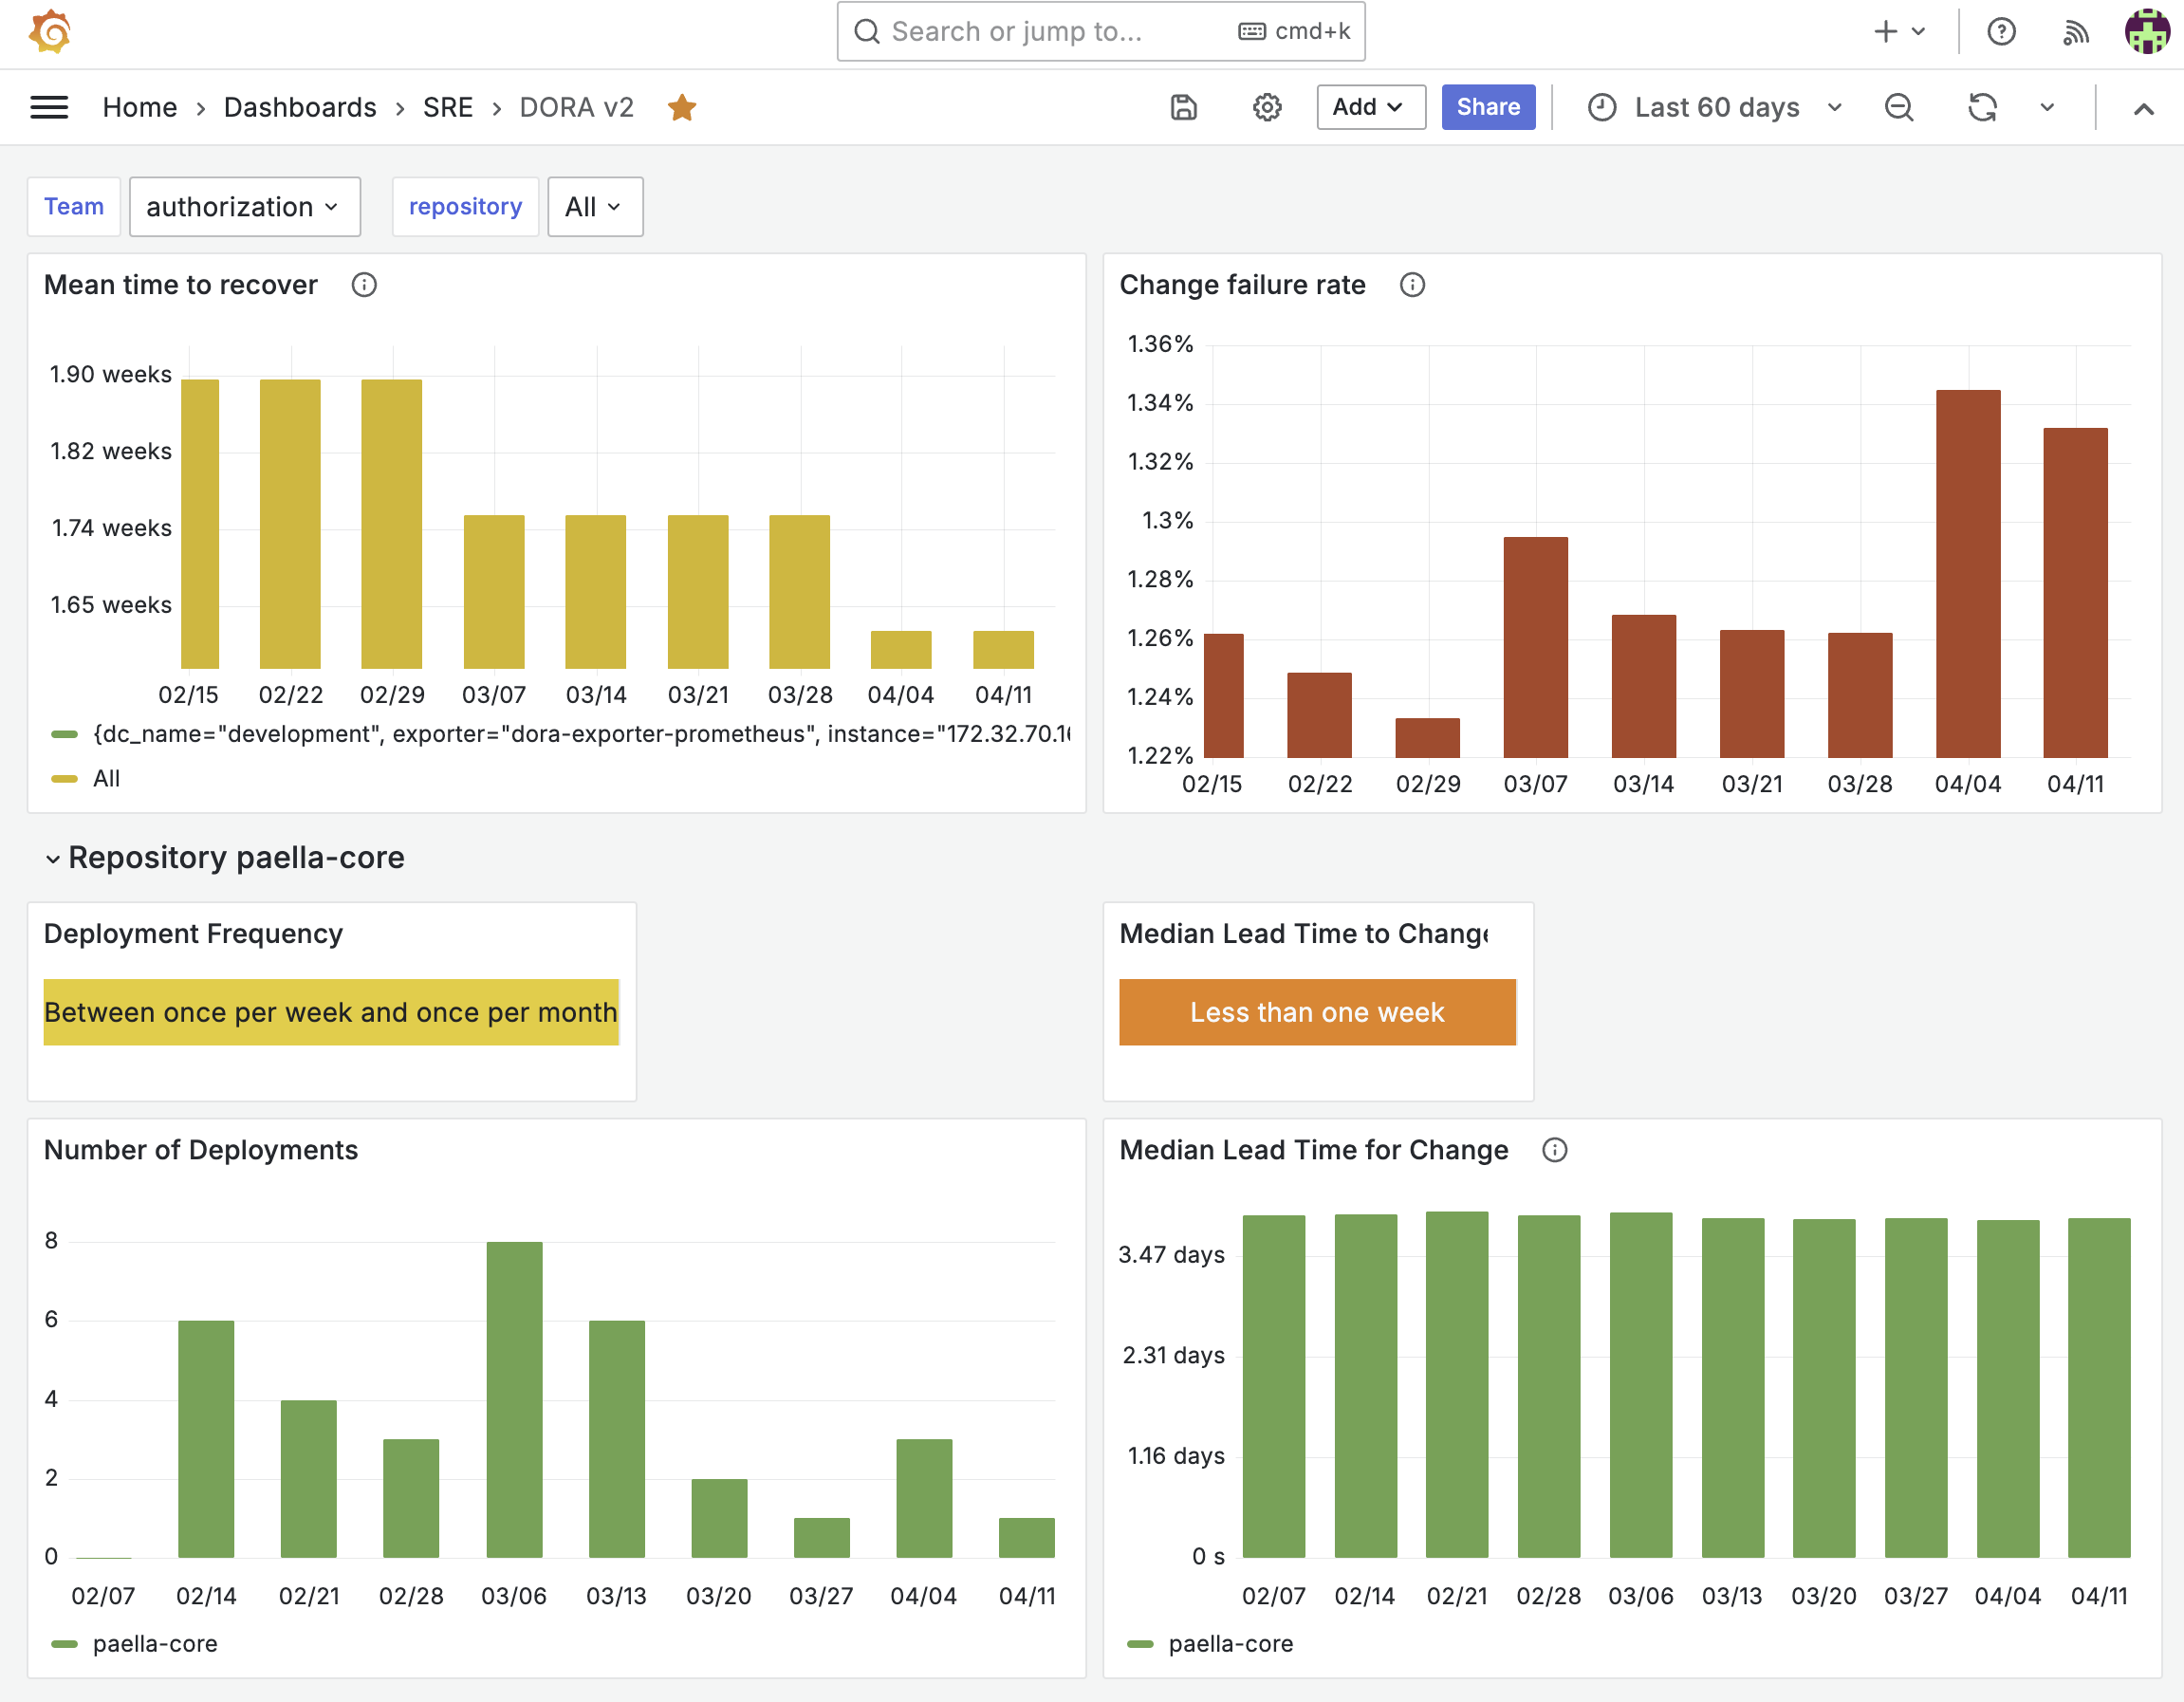
The DORA Exporter Grafana Dashboard, enhanced with integration capabilities for GitHub and Atlassian Jira, is a powerful tool for DevOps teams aiming to optimize their software delivery processes. This advanced dashboard pulls data directly from these platforms to provide real-time insights into key performance indicators defined by the DevOps Research and Assessment (DORA) group.
Enhanced Features with GitHub and Jira Integration:
Automatic Data Synchronization: Automatically syncs with GitHub and Jira to fetch real-time data related to commits, pull requests, deployment statuses, and issue tracking. This seamless integration ensures that all metrics are up-to-date and reflective of the current state of projects.
Deployment Frequency from GitHub: Tracks how often deployments are performed through GitHub, providing a direct measure of deployment frequency which is one of the critical DORA metrics.
Lead Time for Changes using GitHub and Jira: Measures the time from the first commit in GitHub to the deployment in production. This metric is enriched with data from Jira that tracks the progress of issues from creation to deployment, giving teams detailed insight into their lead time for changes.
Change Failure Rate Analysis: Analyzes the change failure rate by correlating deployment data from GitHub with detected issues and failures logged in Jira. This allows teams to identify problematic deployments and focus on improving their reliability.
Time to Restore Service with Jira Integration: Monitors the time taken to restore service after a failure, using Jira's tracking of issue resolutions and operational downtimes, providing teams with crucial data to minimize downtime impacts.
Context-Rich Visualization: Enhances the data visualization by providing additional context about the deployments and issues directly from GitHub and Jira. This includes links to relevant commits, pull requests, and Jira tickets, making it easy for teams to trace metrics back to their sources for deeper analysis.
Configurable Dashboards for Different Teams: Offers the capability to customize dashboard views based on team-specific needs or focus areas. Teams can create tailored views that highlight the most relevant metrics for their specific processes and workflows involving GitHub and Jira.
Advanced Filtering and Segmentation: Enables advanced filtering options to view metrics by specific repositories and teams. This feature allows stakeholders to segment and analyze data more precisely, enabling targeted improvements.
The integration of GitHub and Jira with the DORA Exporter Grafana Dashboard transforms it into an indispensable tool for modern software development teams. It not only automates the measurement of critical DevOps metrics but also provides actionable insights that help in continuous improvement of deployment practices and overall project management.
Data source config
Collector config:
Upload an updated version of an exported dashboard.json file from Grafana
| Revision | Description | Created | |
|---|---|---|---|
| Download |