ArchiSteamFarm
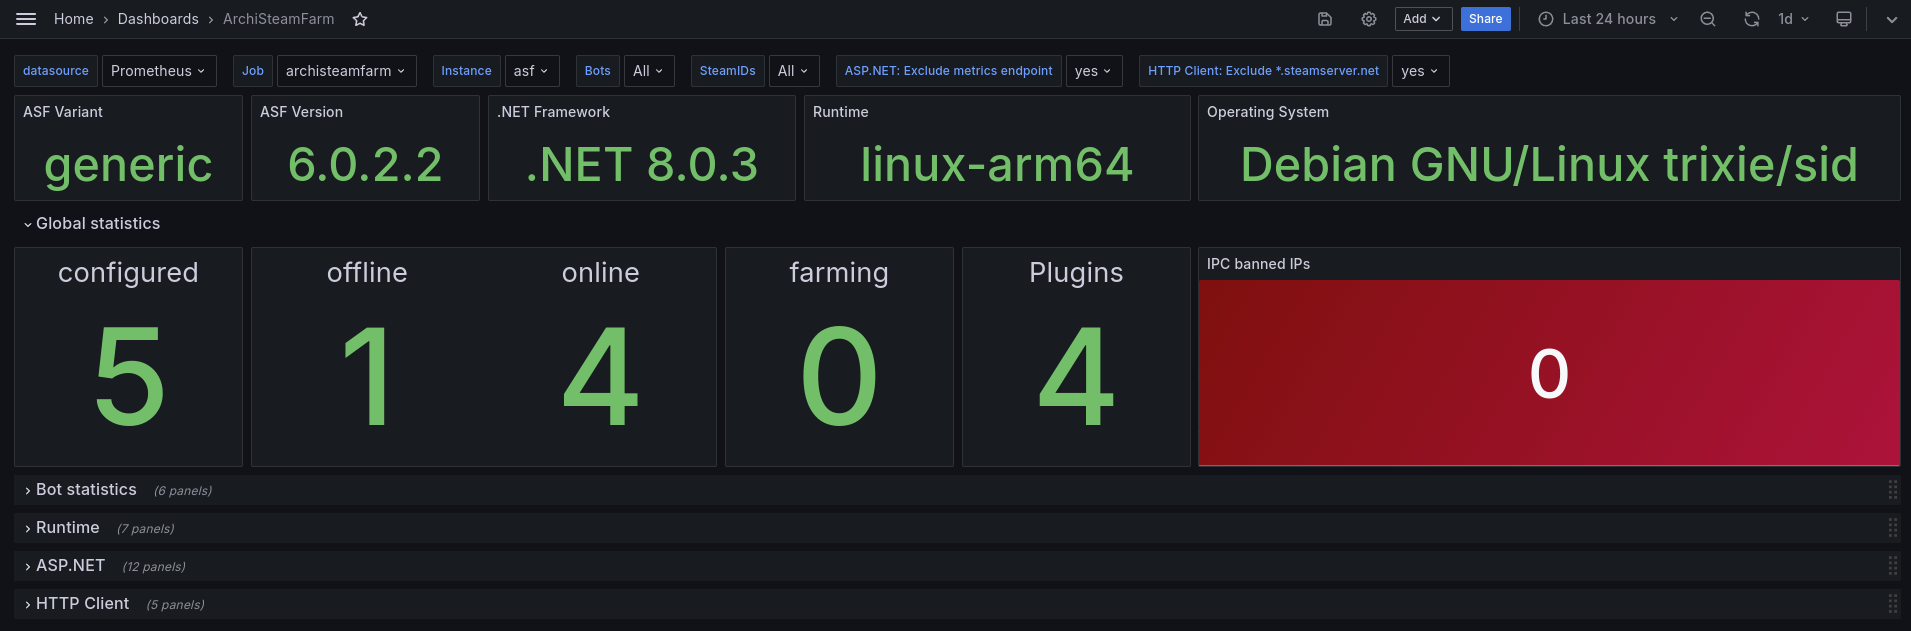
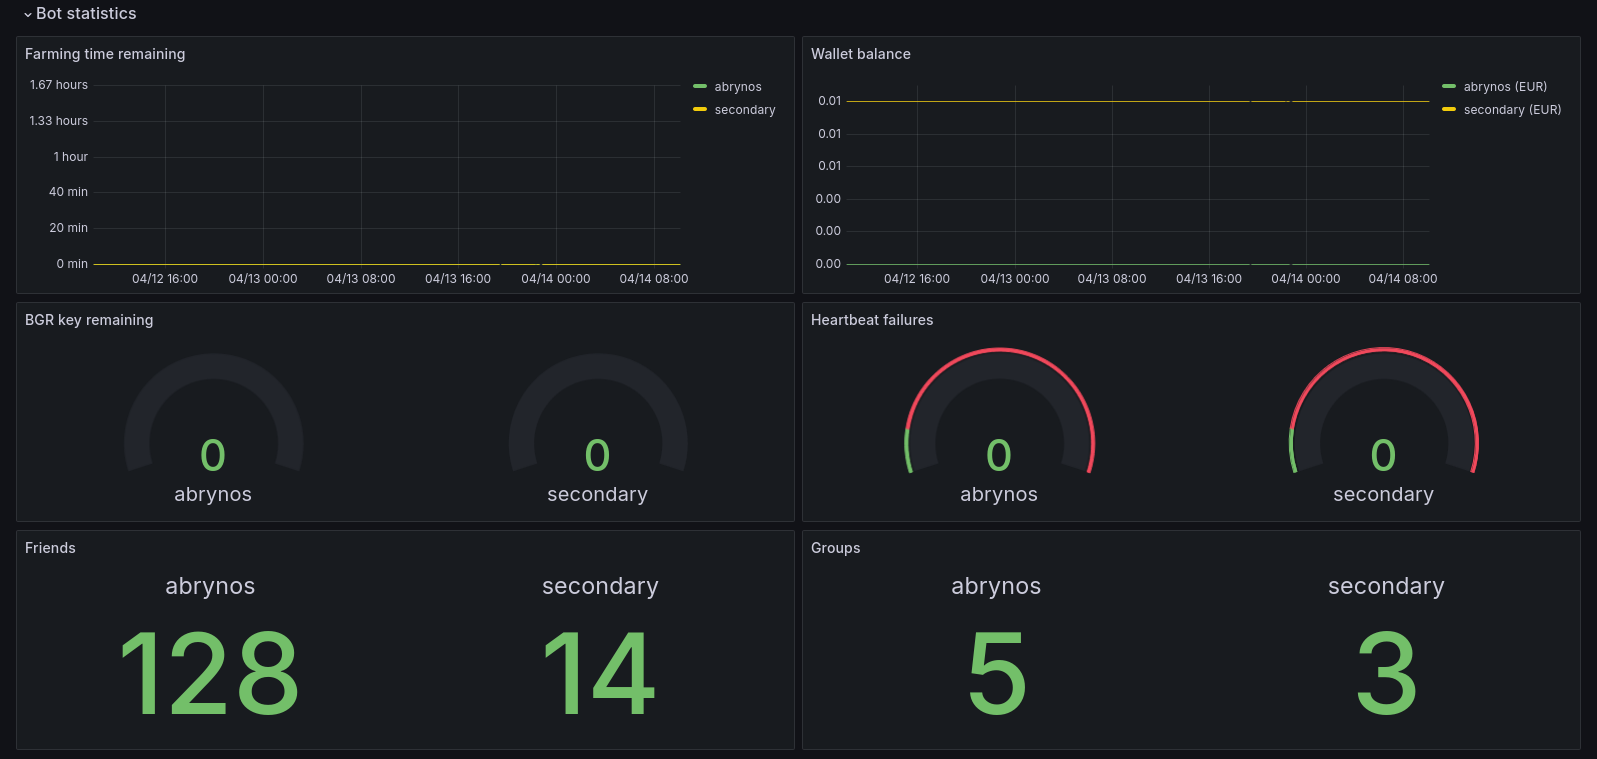
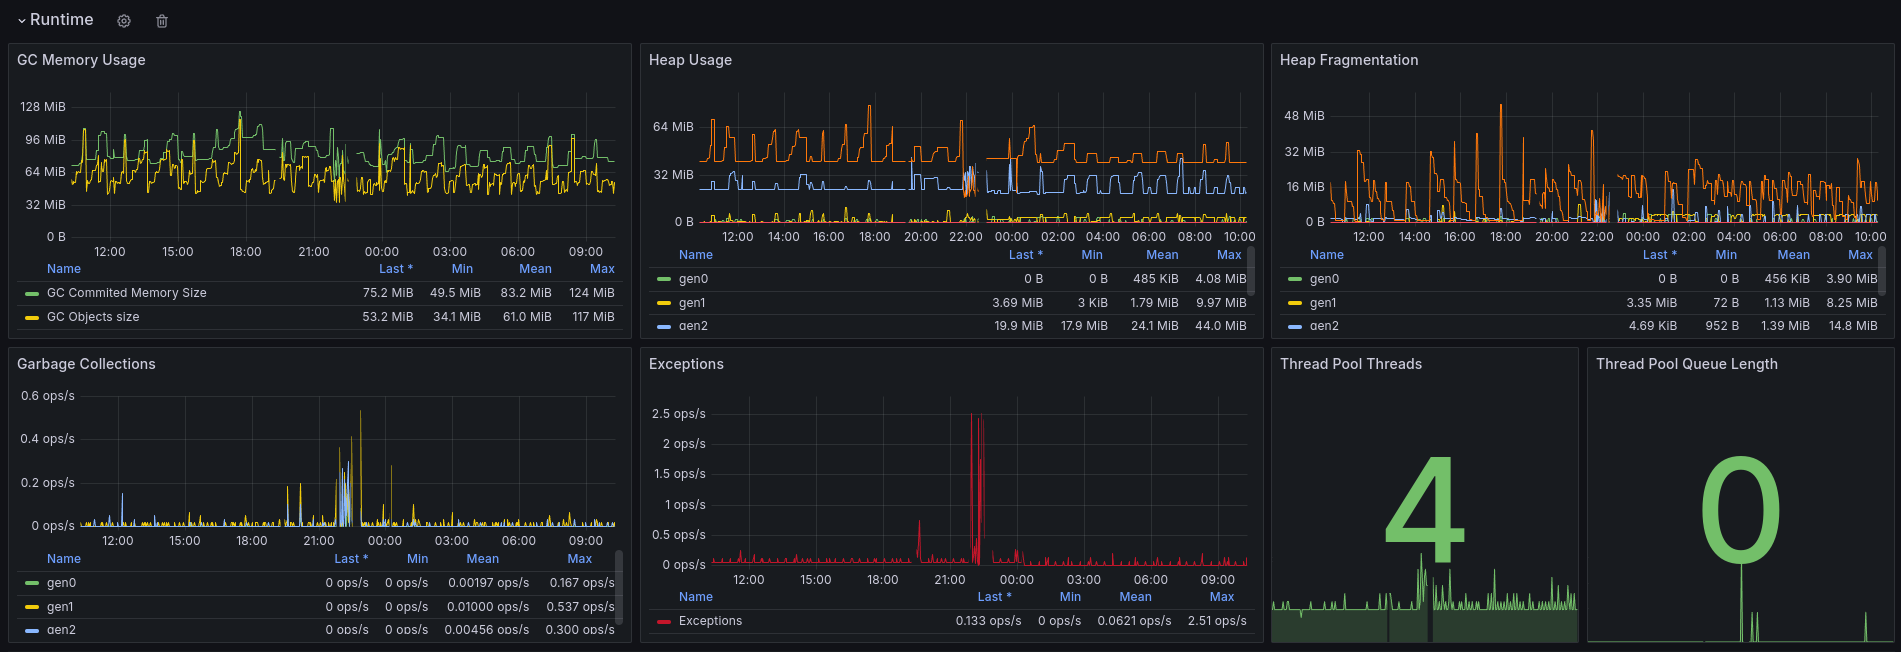
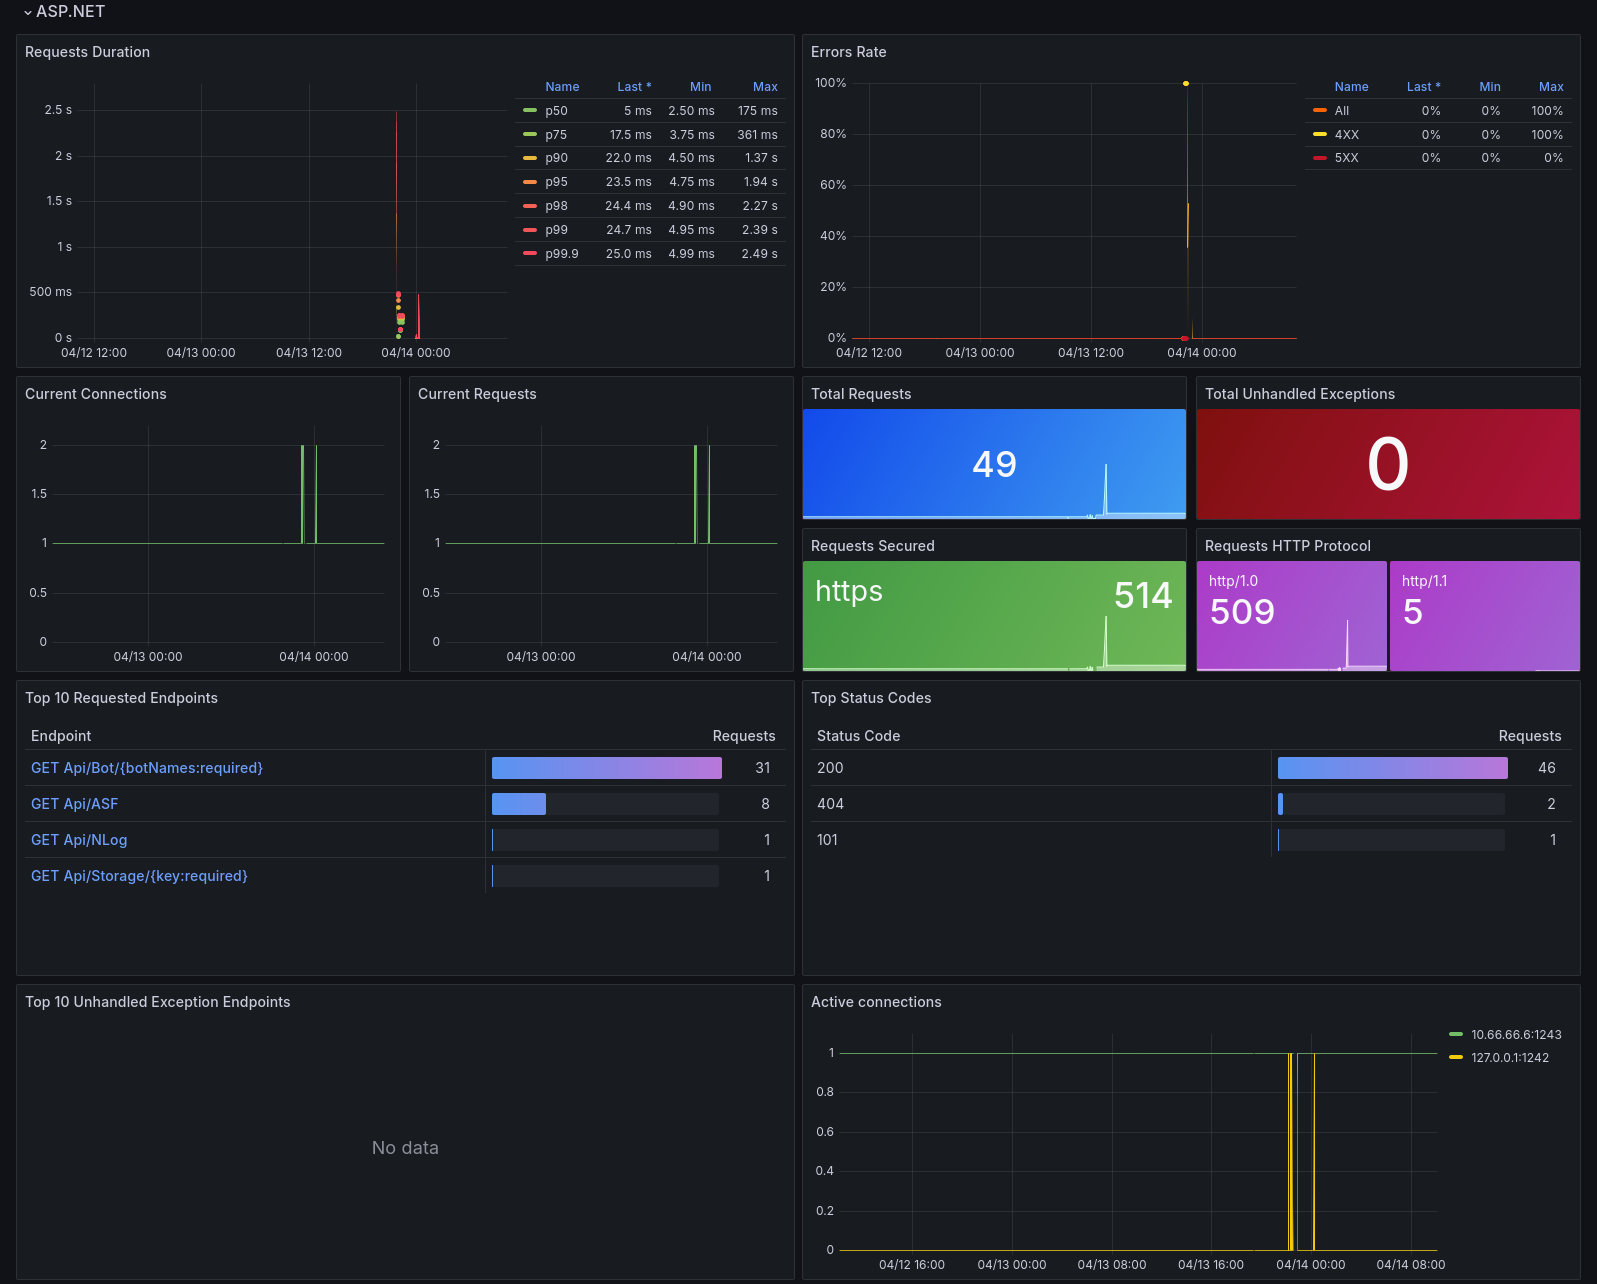
Nearly all values exported to Prometheus by ArchiSteamFarms official MonitoringPlugin.
Only requires generic deployment of ASFs main binary. Does not require any specific job_name and can handle (optional) custom instance labels. Add as many jobs/targets as you need in /etc/prometheus/prometheus.yml:
  - job_name: archisteamfarm
    params:
      password: ['MySupersecretPassword']
    metrics_path: /Api/metrics
    static_configs:
      - targets: ['10.0.0.42:1243']
        labels:
          instance: 'raspberry-pi-4'
Supports monitoring plugin version 6.0.2.2 and onwards.
Data source config
Collector type:
Collector plugins:
Collector config:
Revisions
Upload an updated version of an exported dashboard.json file from Grafana
| Revision | Description | Created | |
|---|---|---|---|
| Download |