Promtail Monitoring - Metrics and Logs
Monitor Promtail metrics and logs
Promtail Metrics and Logs
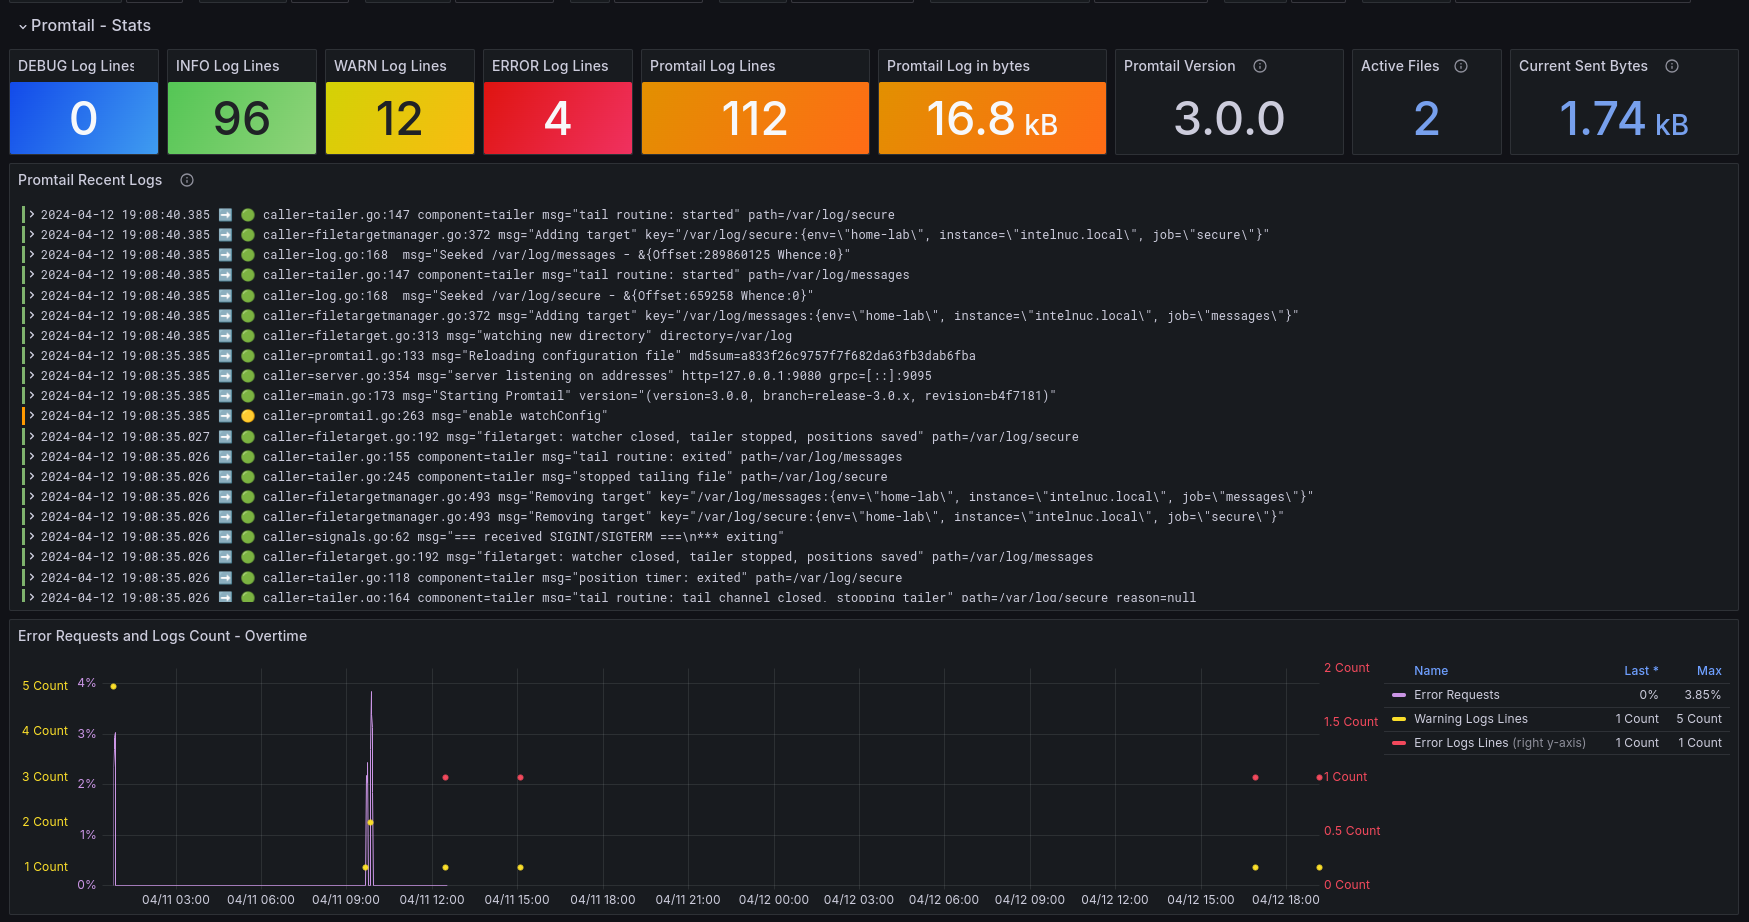
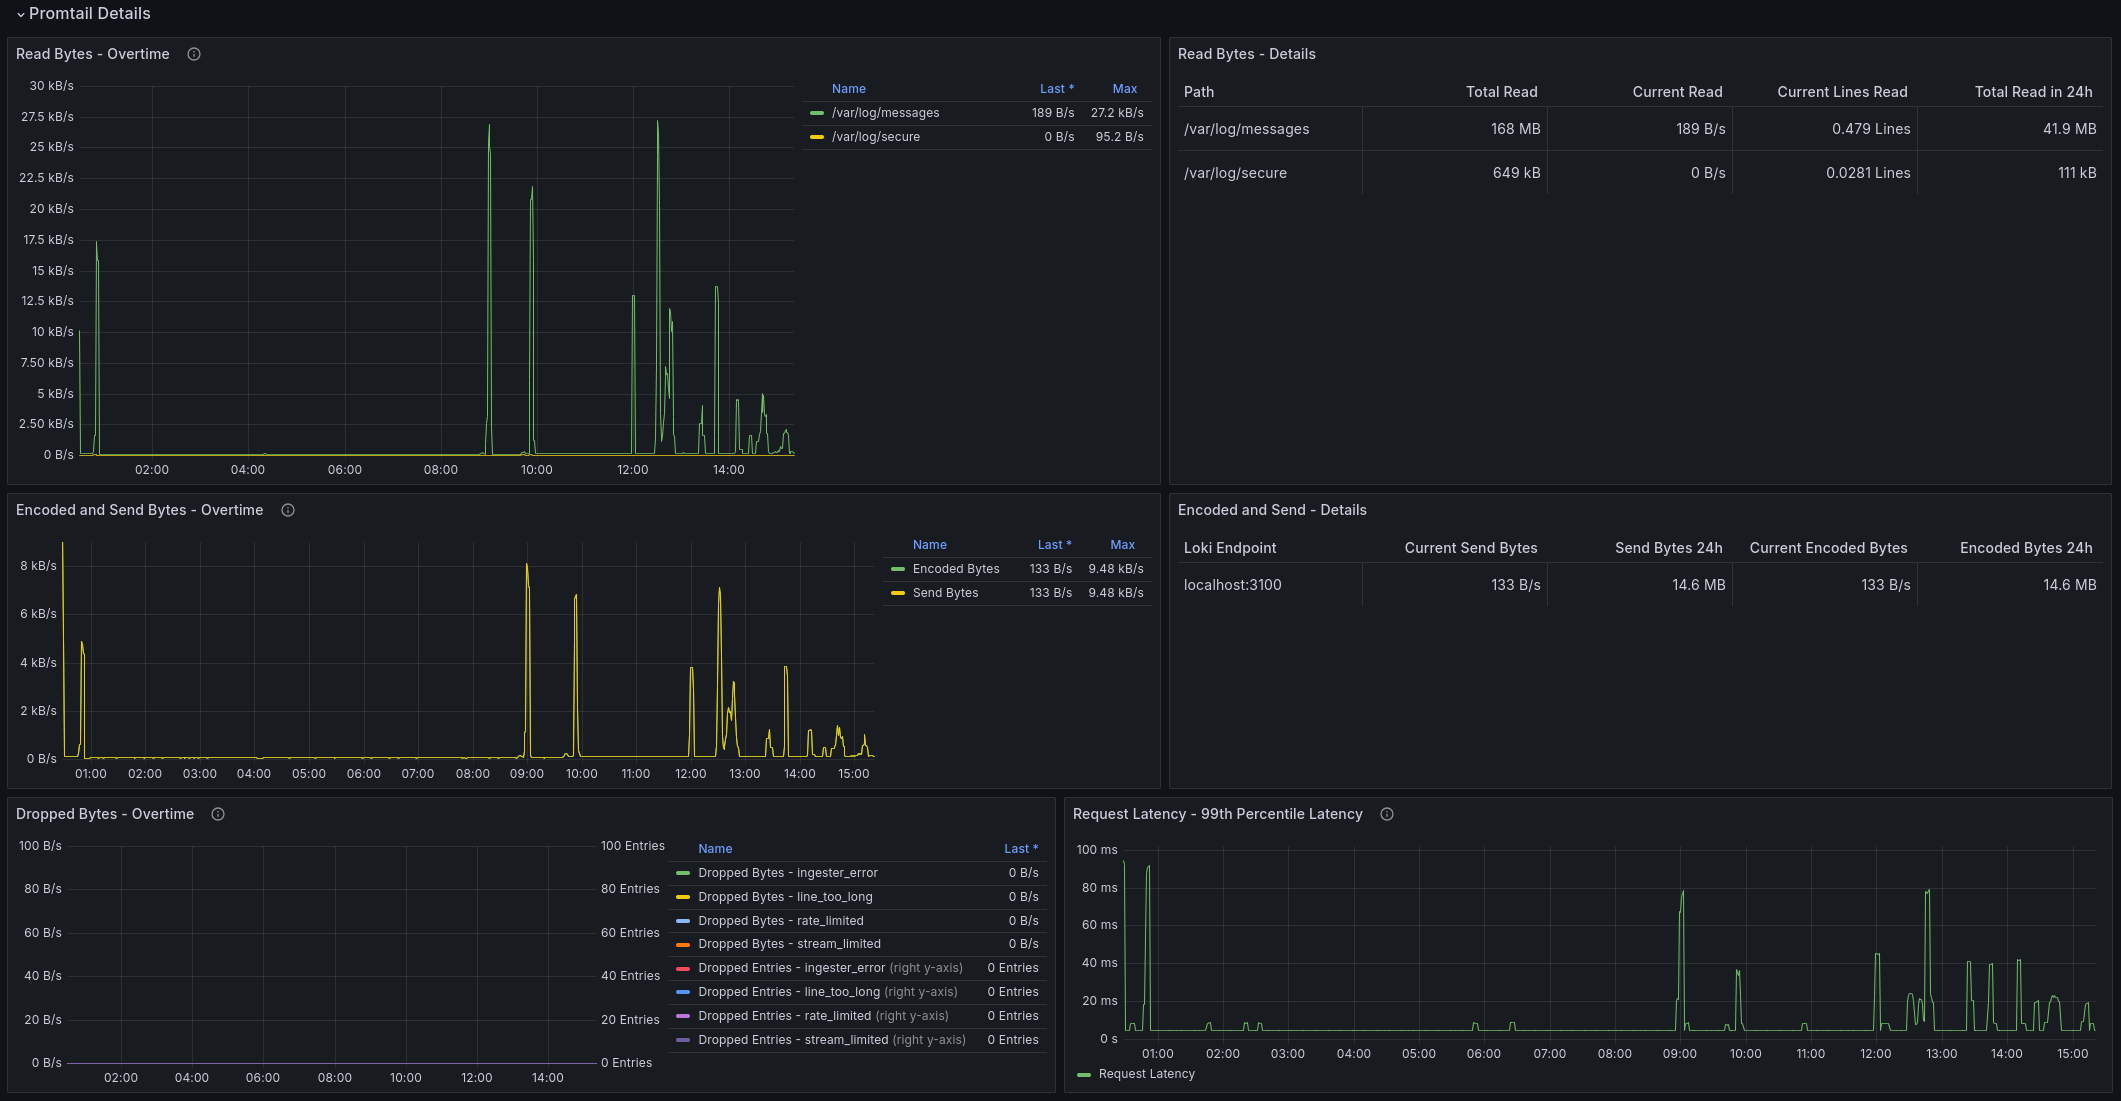
Visualize Promtail metrics and logs. If you have several servers with Promtail deployed, shipping logs to Loki, this dashboard will provide insights into Promtail's behavior when needed.
How to use this dashboard with explanation in blog: https://voidquark.com/blog/promtail-grafana-dashboard .
Source Code
GitHub repo link: https://github.com/voidquark/grafana-dashboards
Author
Created by VoidQuark
Data source config
Collector type:
Collector plugins:
Collector config:
Revisions
Upload an updated version of an exported dashboard.json file from Grafana
| Revision | Description | Created | |
|---|---|---|---|
| Download |
Grafana Loki (self-hosted)
Easily monitor Grafana Loki (self-hosted), a horizontally scalable, highly available, multi-tenant log aggregation system inspired by Prometheus, with Grafana Cloud's out-of-the-box monitoring solution.
Learn more