Aerospike Batch Transactions View
Dashboard helps visualise multiple stats at batch transaction processing including read, write, delete, proxy, tsvc etc.,
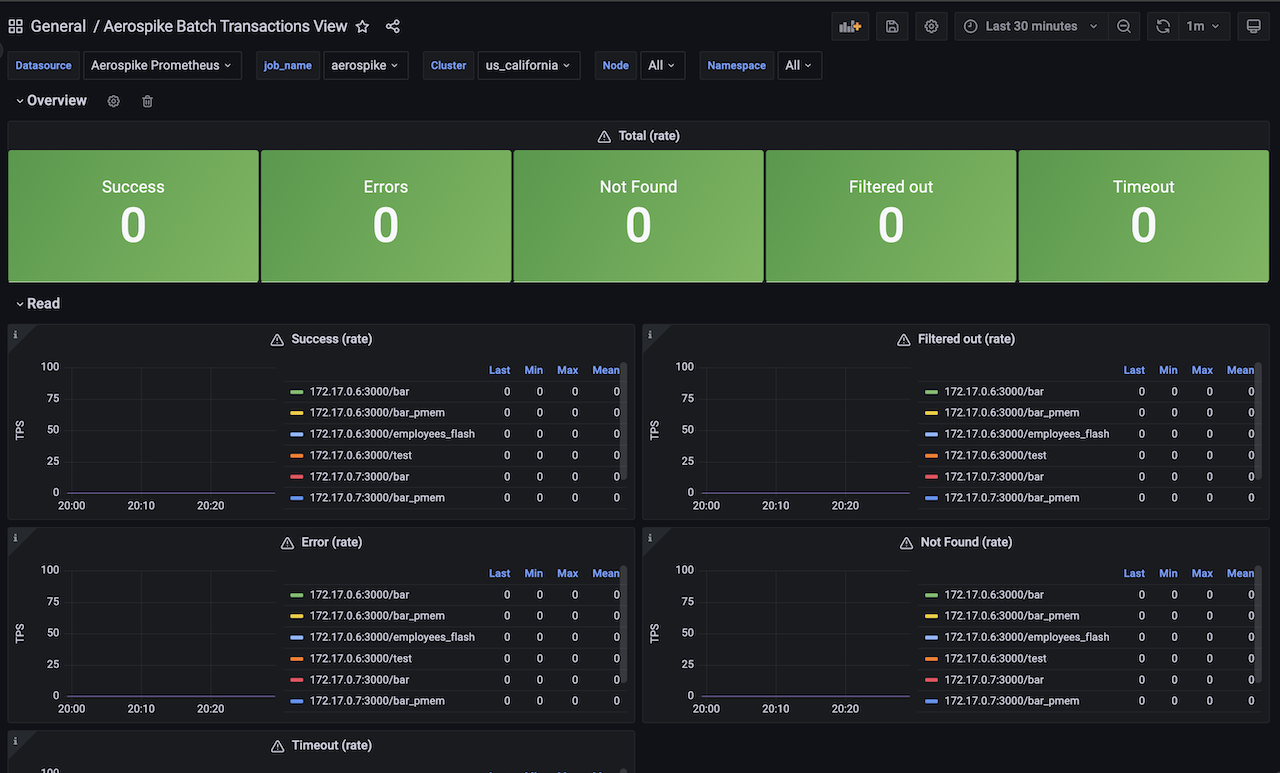
The Aerospike Batch Transactions View dashboard uses the prometheus data source to create a Grafana dashboard with the stat and timeseries panels.
Data source config
Collector type:
Collector plugins:
Collector config:
Revisions
Upload an updated version of an exported dashboard.json file from Grafana
| Revision | Description | Created | |
|---|---|---|---|
| Download |
Aerospike
Easily monitor Aerospike, a multi-modal NoSQL and graph database, with Grafana Cloud's out-of-the-box monitoring solution.
Learn more