NUT UPS Telegraf
A dashboard to display data exported by NUT UPS
NUT in Grafana Dashboard
Description:
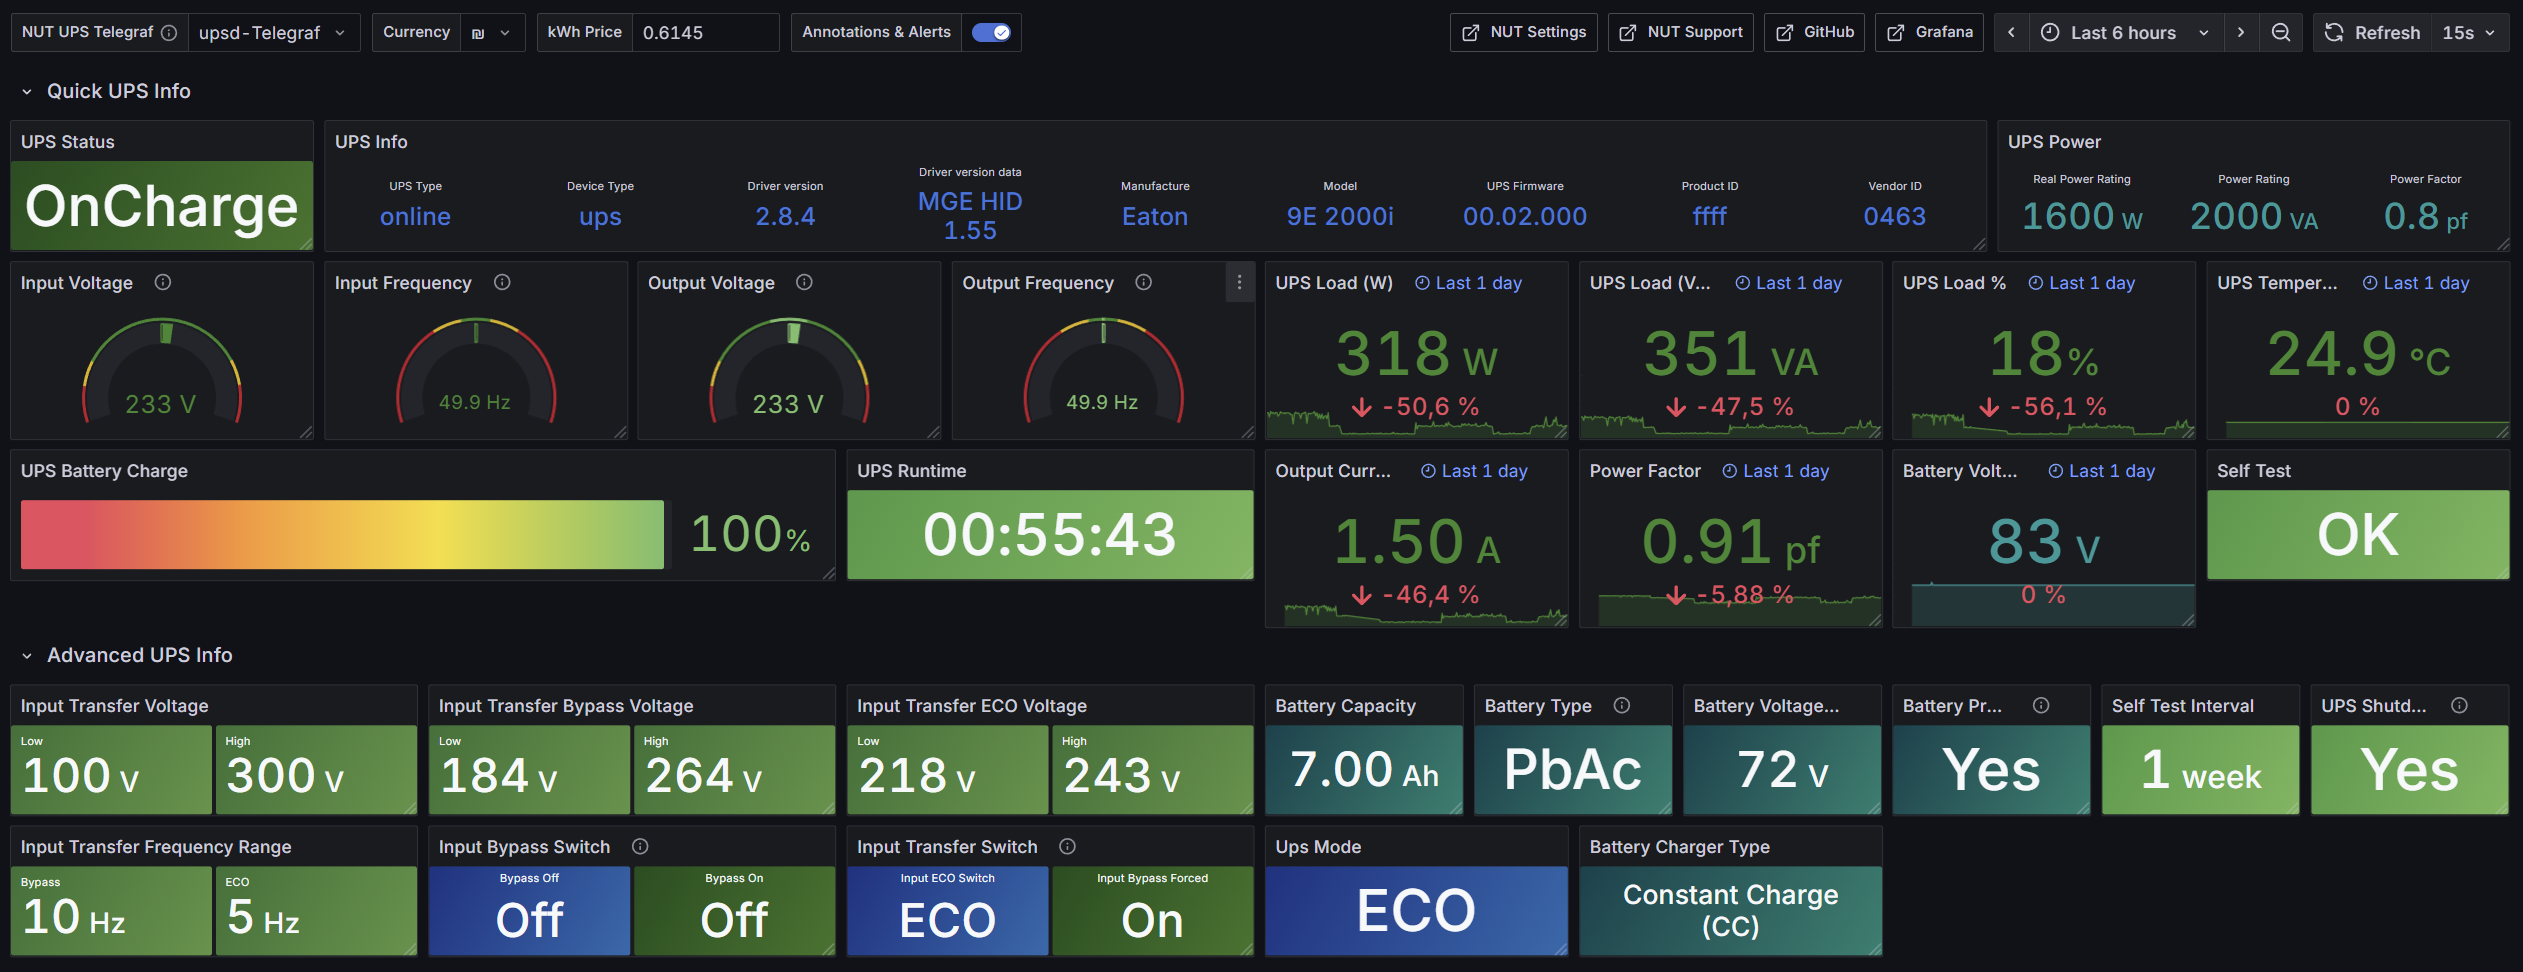
A comprehensive dashboard for visualizing data exported from Network UPS Tools (NUT) for UNRAID plugin or any other Linux system with NUT using InfluxDBv2 through Telegraf or similar tools. This dashboard leverages the NUT driver in Telegraf to collect UPS metrics and stores them in InfluxDB, which can then be visualized in Grafana.
- NUT -> Telegraf -> InfluxDBv2 -> Grafana
Key Features:
- Real-time Monitoring: Display real-time data from your UPS.
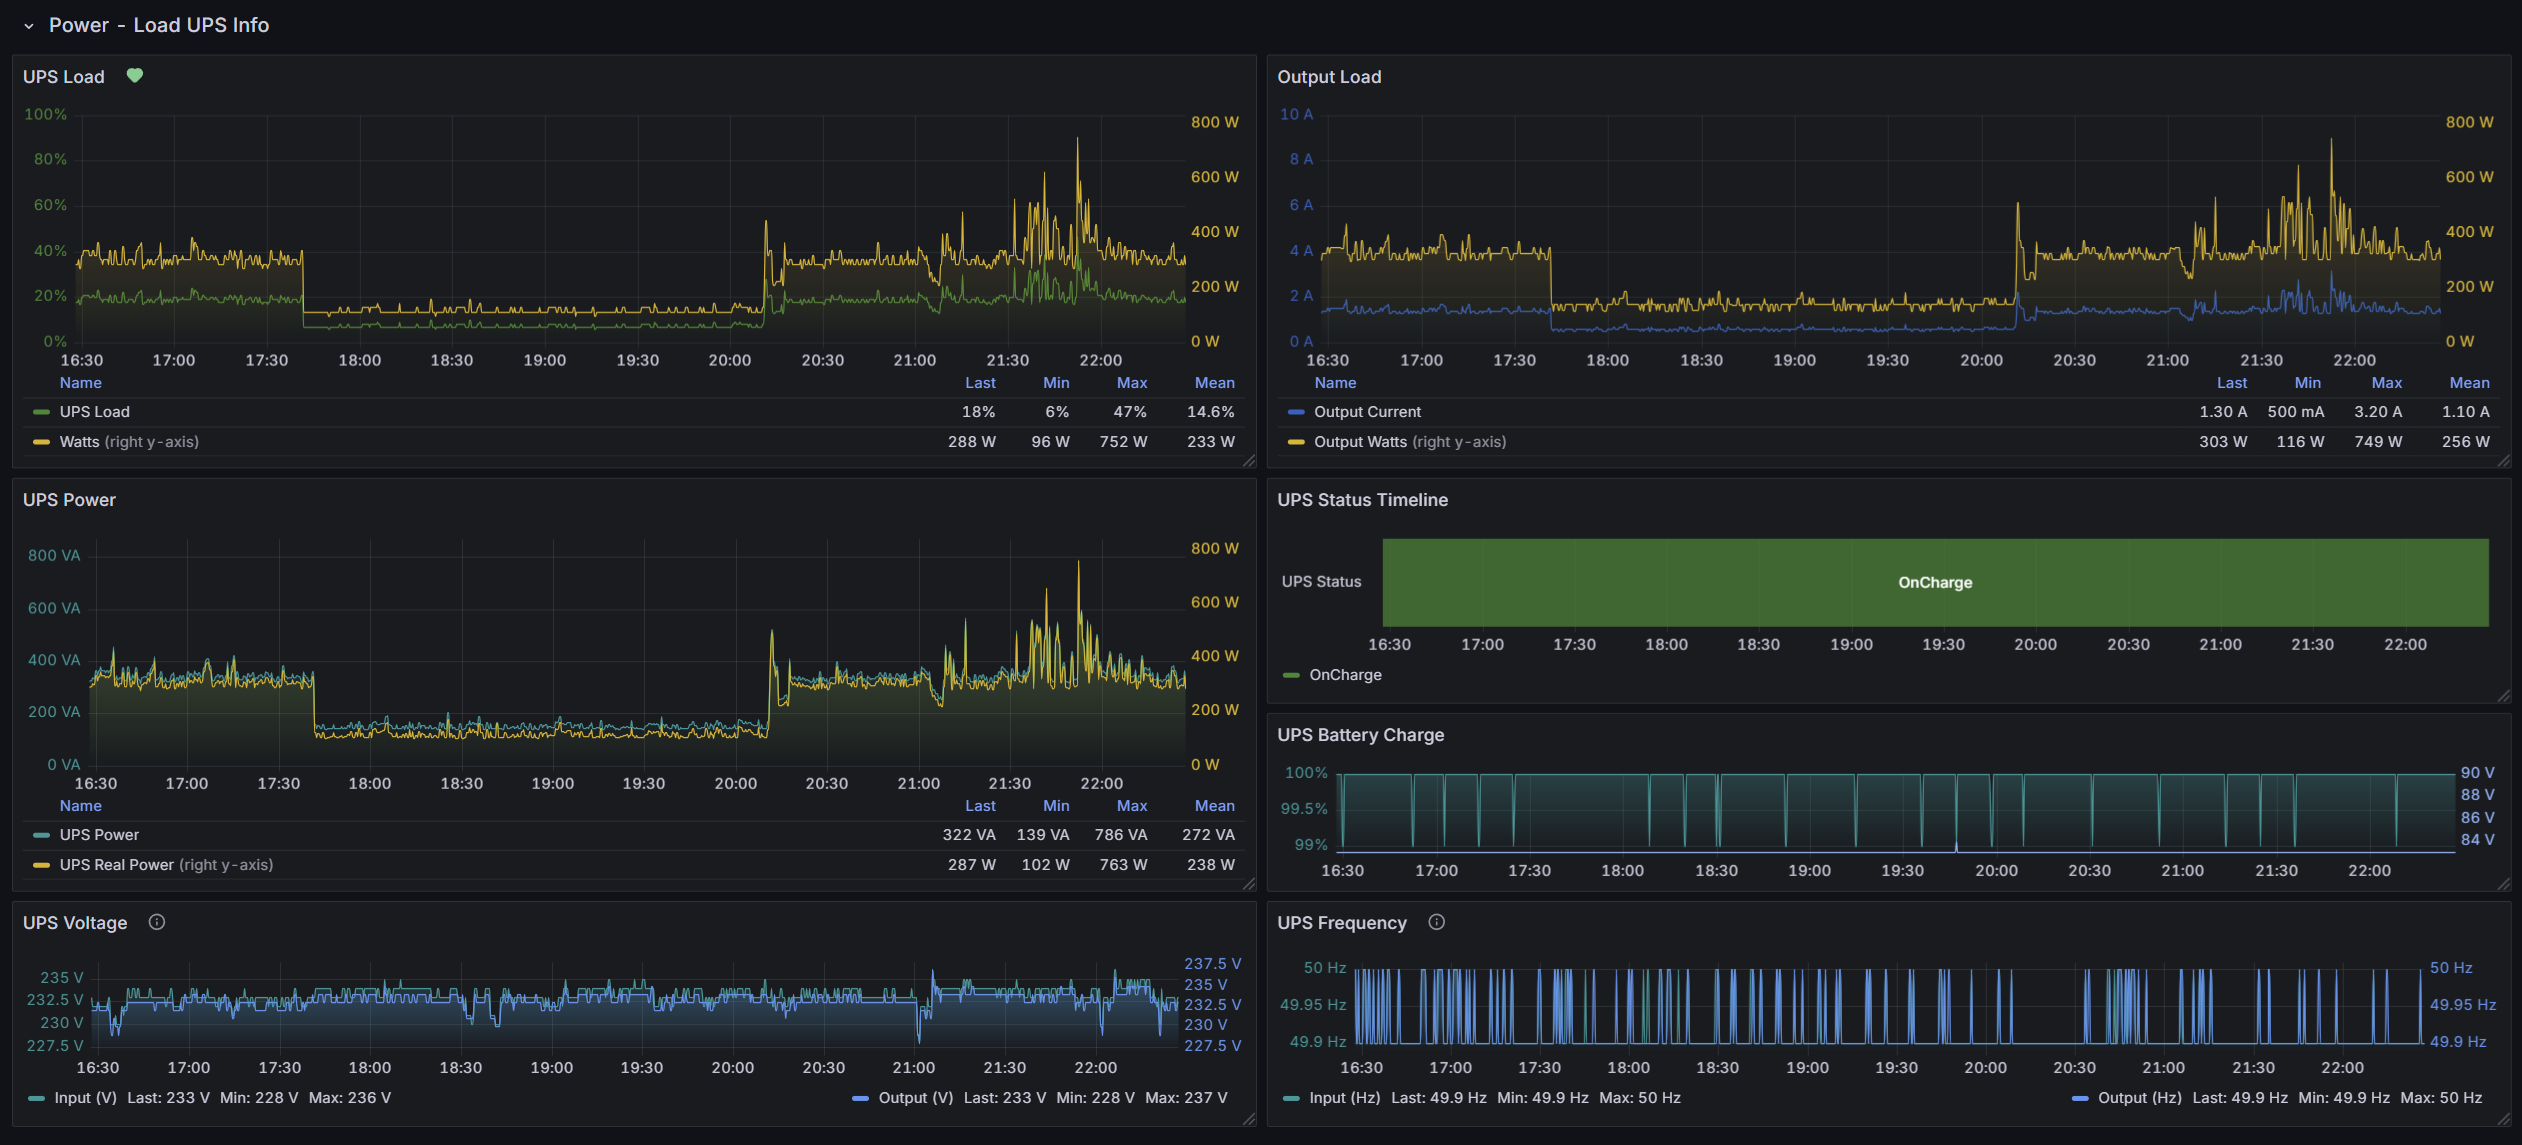
- Historical Data: Visualize historical UPS data over time.
- Customizable Dashboard: Tailor the dashboard to include specific metrics like voltage, current, load, and temperature.
- Integrations: Easily integrate with UNRAID or any Linux system running NUT.
Grafana Dashboard ID: 20846
Updates
31.08.2025
- Added more variables for Advanced UPS Info.
- Input/Output gauges now have symmetric thresholds with descriptions.
- Added Input/Output Voltage and Frequency Time Series panels with thresholds.
- Updated mapping values to use regex + several fixes.
17.03.2025
- Optimized static stat panels to show only the last values.
- General fixes.
27.09.2024
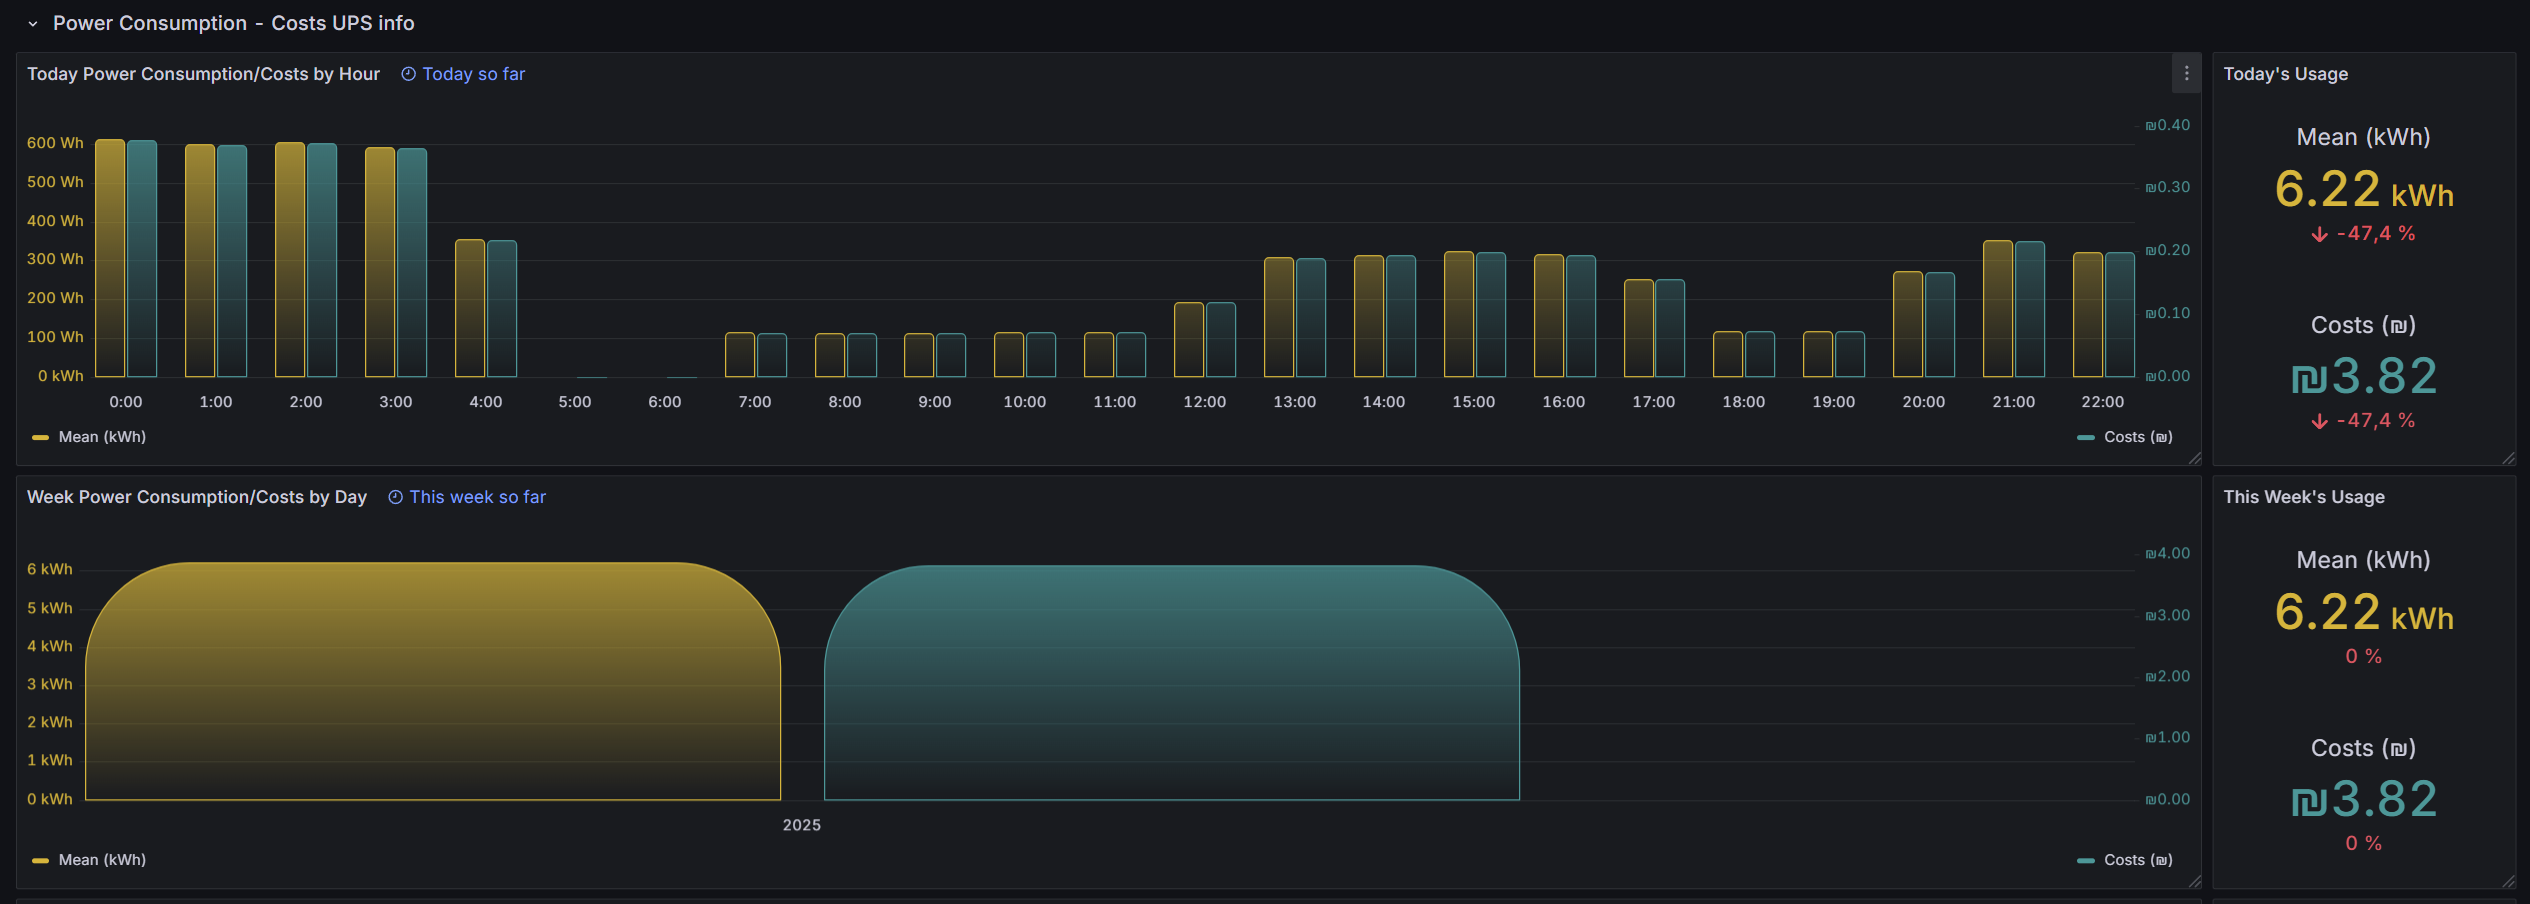
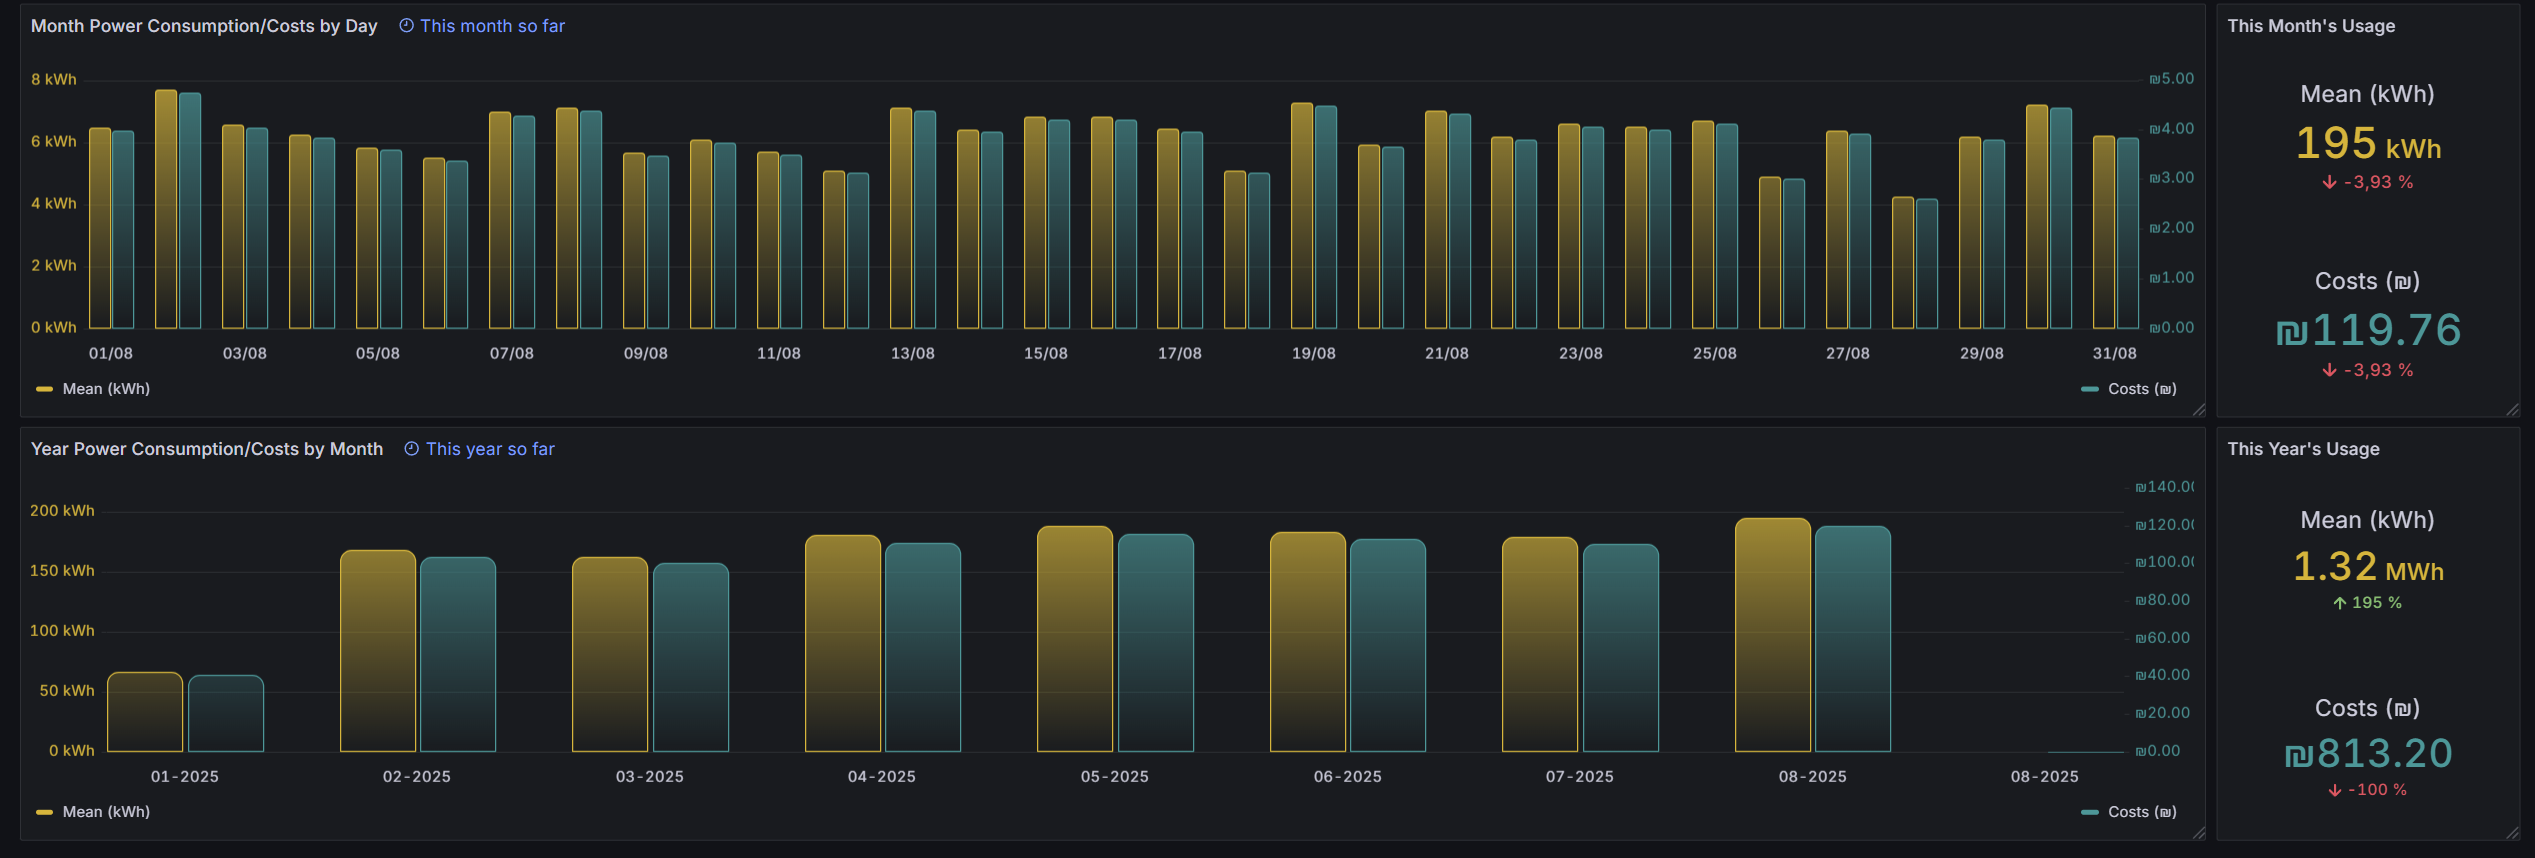
- Added Power Consumption – Costs UPS info panels.
14.08.2024
- Added more info + fixes.
28.05.2024
- Added multi-bucket support.
Steps
You can change bucket name and add multiple buckets by :
- Go to Dashboard Setting - Variables - Click on bucket - Custom options:
- add next to telegraf config:
# Monitor UPSes connected via Network UPS Tools
[[inputs.upsd]]
  ## A running NUT server to connect to.
  ## IPv6 addresses must be enclosed in brackets (e.g. "[::1]")
   server = "your IP"
   port = 3493
  # username = "user"
  # password = "password"
additional_fields = ["*"]
Map enum values according to given table.
## UPS beeper status (enabled, disabled or muted)
Convert 'enabled' and 'disabled' values back to string from boolean
[[processors.enum]]
[[processors.enum.mapping]]
field = "ups_beeper_status"
[processors.enum.mapping.value_mappings]
true = "enabled"
false = "disabled"
[[outputs.influxdb_v2]]
The URLs of the InfluxDB cluster nodes.
Add all your info for influxDbv2
Links
Data source config
Collector config:
Upload an updated version of an exported dashboard.json file from Grafana
| Revision | Description | Created | |
|---|---|---|---|
| Download |