Memcached Pods monitoring (via Prometheus) v1
Monitors Kubernetes Memcached Pods. Shows memory usage, hit rate, evicts and reclaims rate, items in cache, network stats, commands rate. Requires Memcached Exporter for Prometheus.
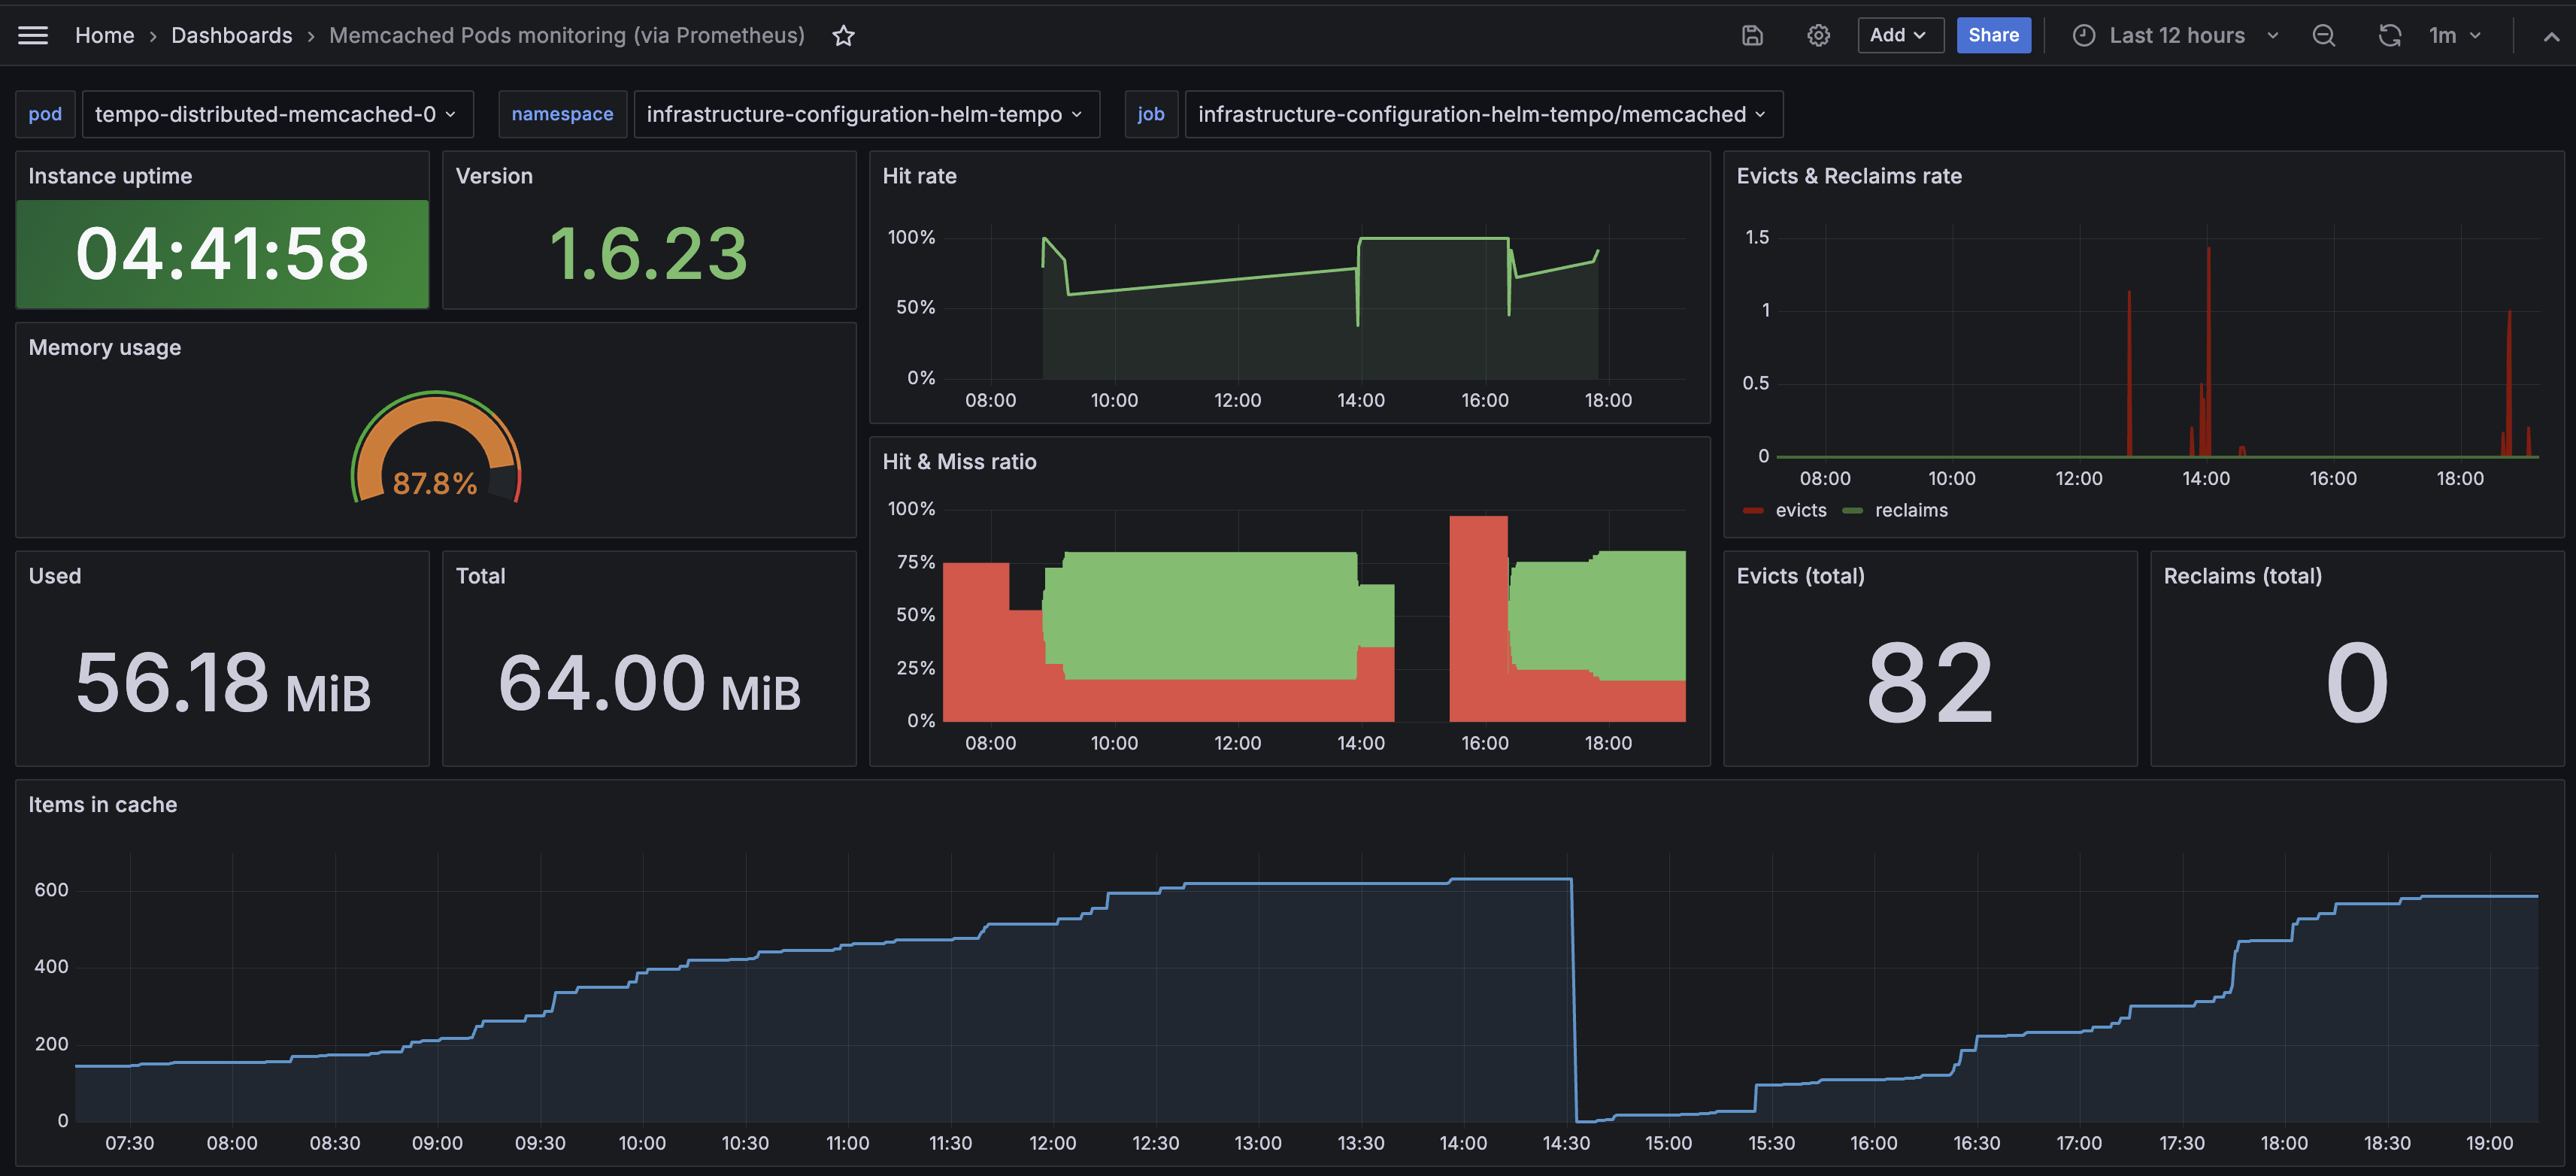
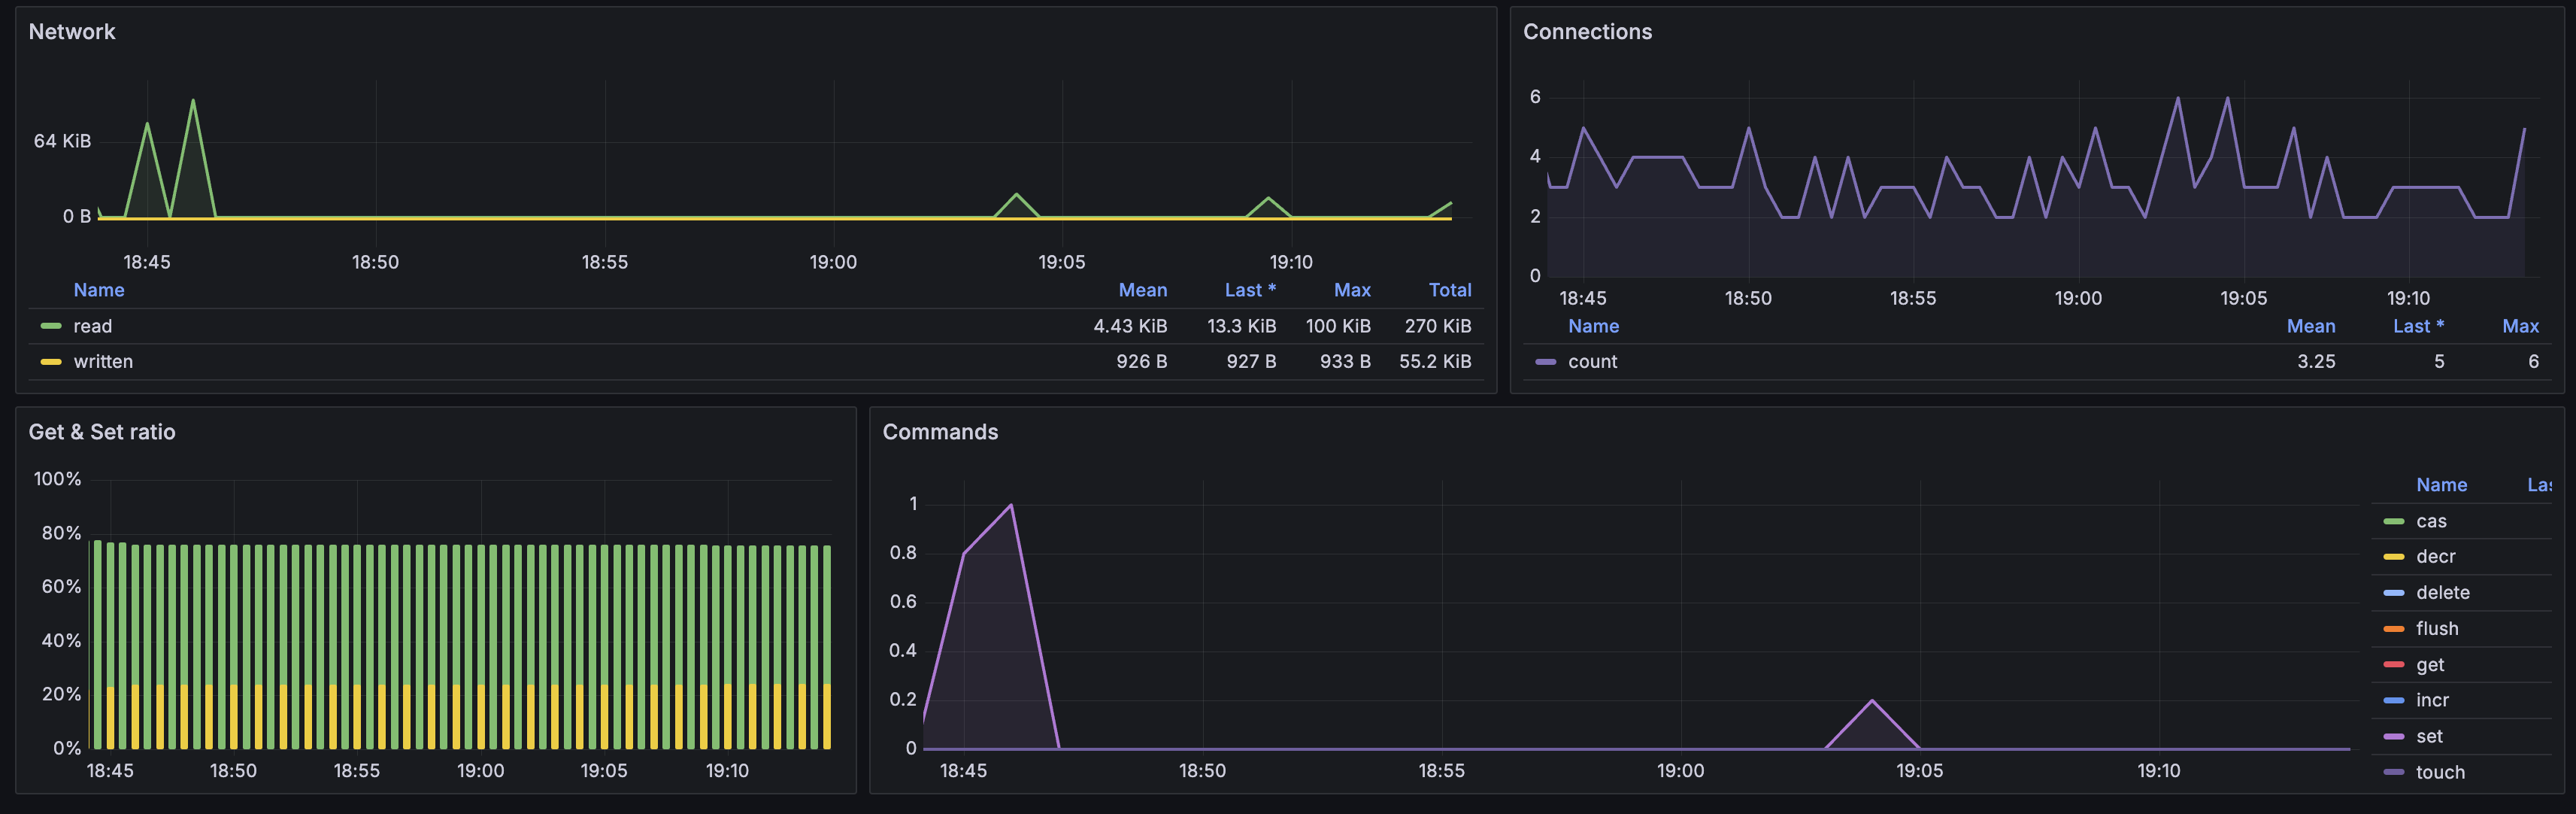
The Memcached Pods monitoring (via Prometheus) v1 dashboard uses the prometheus data source to create a Grafana dashboard with the gauge, stat and timeseries panels.
Data source config
Collector type:
Collector plugins:
Collector config:
Revisions
Upload an updated version of an exported dashboard.json file from Grafana
| Revision | Description | Created | |
|---|---|---|---|
| Download |
Memcached
Easily monitor Memcached, the distributed, in-memory key-value store, with Grafana Cloud's out-of-the-box monitoring solution.
Learn more