
Fail2Ban Logs
Fail2Ban log analyses based on Loki and Promtail.
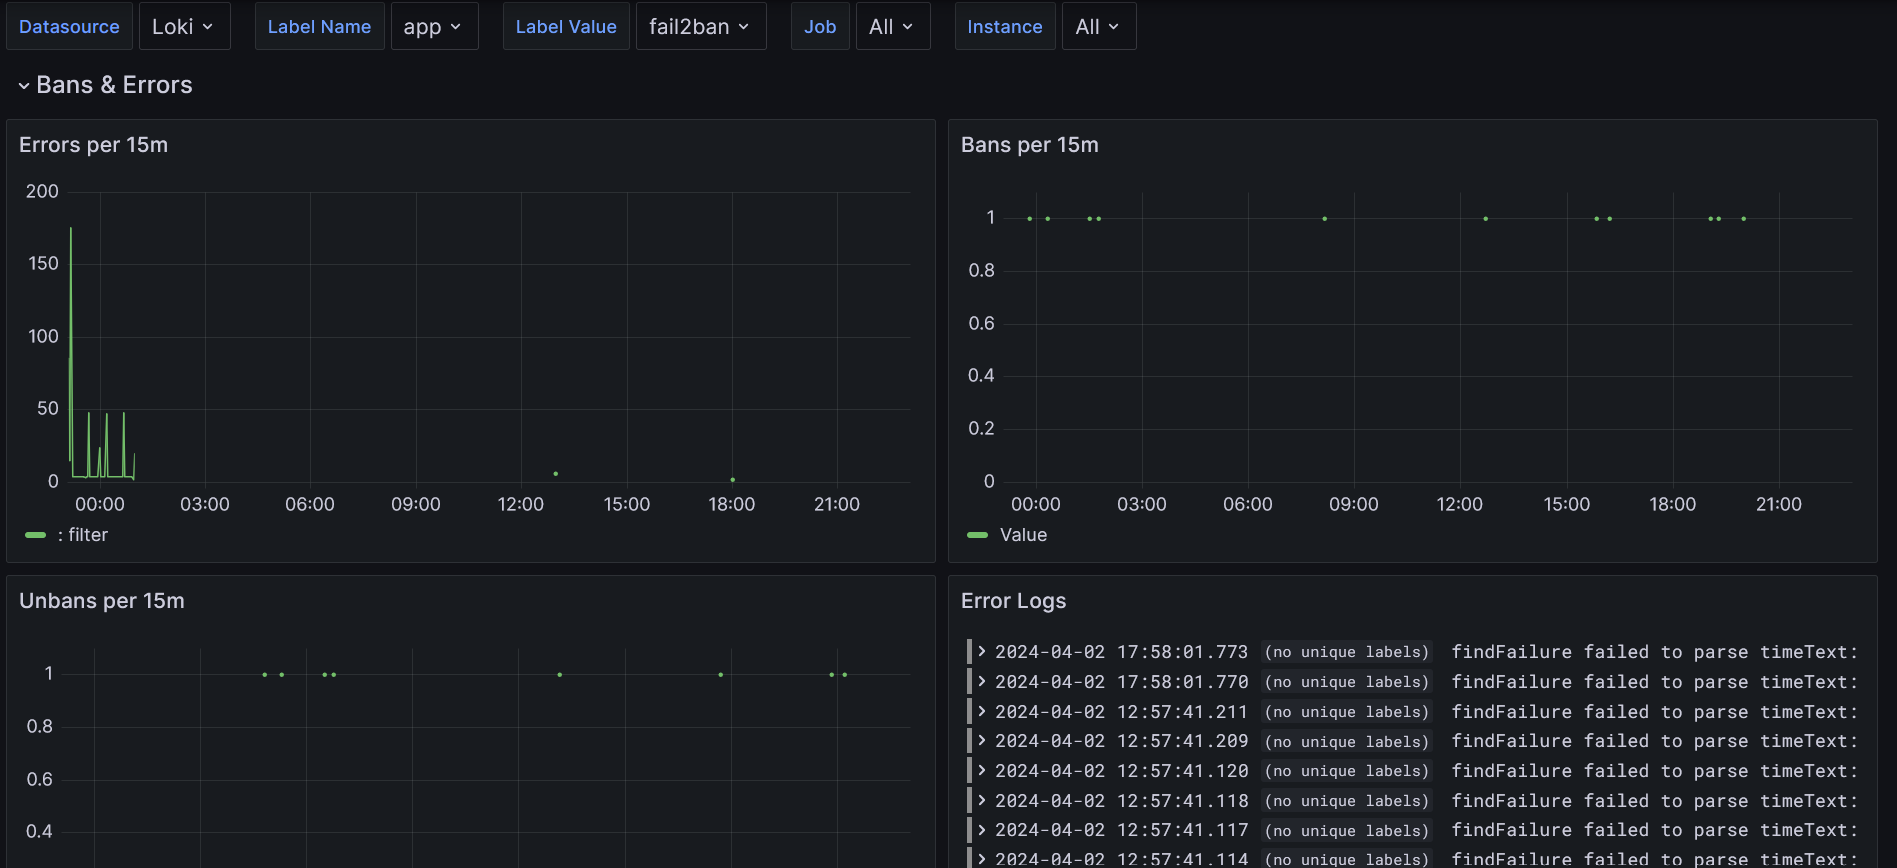
This Dashboard uses loki and promtail to scrape fail2ban logs. You need separate loki and promtail instances running to serve the data for Grafana. You can rename the labels to arbitrary values - the Dashboard supports selection based on labels.
I do use the solution with a fail2ban docker image, so mind this when reading through the docs.
The dashboard and the config are mostly based on this great gist and this piece.
This is the docker-compose.yml I use:
version: '3'

services:

  fail2ban:
    image: crazymax/fail2ban:latest
    container_name: fail2ban
    restart: "unless-stopped"
    network_mode: "host"
    cap_add:
      - NET_ADMIN
      - NET_RAW
    volumes:
      # stores filter.d, action.d and jail.d folders
      - ./fail2ban-data:/data
      # accesses logs from host machine
      - /var/log:/var/log:ro
      - /var/lib/docker/containers/:/container-logs/:ro
      - /etc/localtime:/etc/localtime:ro
      # shared folder for logs
      - ./fail2ban-logs:/fail2ban-logs
    environment:
      # reroute log to fail2ban.log file
      - F2B_LOG_TARGET=/fail2ban-logs/fail2ban.log
      - F2B_LOG_LEVEL=INFO
      - F2B_DB_PURGE_AGE=1d
      - F2B_MAX_RETRY=3
    logging:
      driver: "json-file"
      options:
        max-size: "5m"
        max-file: "10"

  promtail:
    image: grafana/promtail:latest
    container_name: promtail
    restart: unless-stopped
    command: -config.file=/etc/promtail/docker-config.yaml
    volumes:
      # folder for promtail config
      - ./promtail:/etc/promtail
      # accesses fail2ban shared folder
      - ./fail2ban-logs:/var/log/fail2ban:ro

  loki:
    image: grafana/loki:main
    container_name: loki
    restart: always
    ports:
      - 3100:3100
    volumes:
      - ./loki:/loki
And this is used for the ./promtail/docker-config.yaml:
(Please feel free to adjust instance, app and env labels according to your preferences)
server:
  http_listen_port: 9080
  grpc_listen_port: 0
positions:
  filename: /tmp/positions.yaml
clients:
  - url: http://loki:3100/loki/api/v1/push
scrape_configs:

  - job_name: fail2ban
    static_configs:
      - targets:
        - localhost
        labels:
          __path__: /var/log/fail2ban/fail2ban.log
          instance: your-instance-identifier
          app: fail2ban
          env: test-env
    pipeline_stages:
      - multiline:
          firstline: '\d{4}-\d{2}-\d{2} \d{2}:\d{2}:\d{2}'
      - regex:
          expression: >-
            ^(?s)(?P<time>\S+? \S+?)
            (fail2ban\.)(?P<component>\S+)\s*
            \[(?P<pid>\S+)\]:
            (?P<priority>\S+)\s*
            (?P<message>.*?)$
      - timestamp:
          source: time
          format: '2006-01-02 15:04:05,000'
      - labels:
          component:
          priority:
      - output:
          source: message
      # Extract jail from message, if present
      - match:
          # Note: backticks do not work in promtail, so weird escaping is needed
          selector: '{job="fail2ban"} |~ "\\\\[\\\\S+\\\\] .*"'
          stages:
            - regex:
                expression: '(\[(?P<jail>\S+)\] )?(?P<message>.*?)$'
            - labels:
                jail:
            - output:
                source: message
      - labeldrop:
- filenameData source config
Collector config:
Upload an updated version of an exported dashboard.json file from Grafana
| Revision | Description | Created | |
|---|---|---|---|
| Download |
Grafana Loki (self-hosted)
Easily monitor Grafana Loki (self-hosted), a horizontally scalable, highly available, multi-tenant log aggregation system inspired by Prometheus, with Grafana Cloud's out-of-the-box monitoring solution.
Learn more