AKS Container Logs
View AKS container logs in Grafana using Azure Monitor.
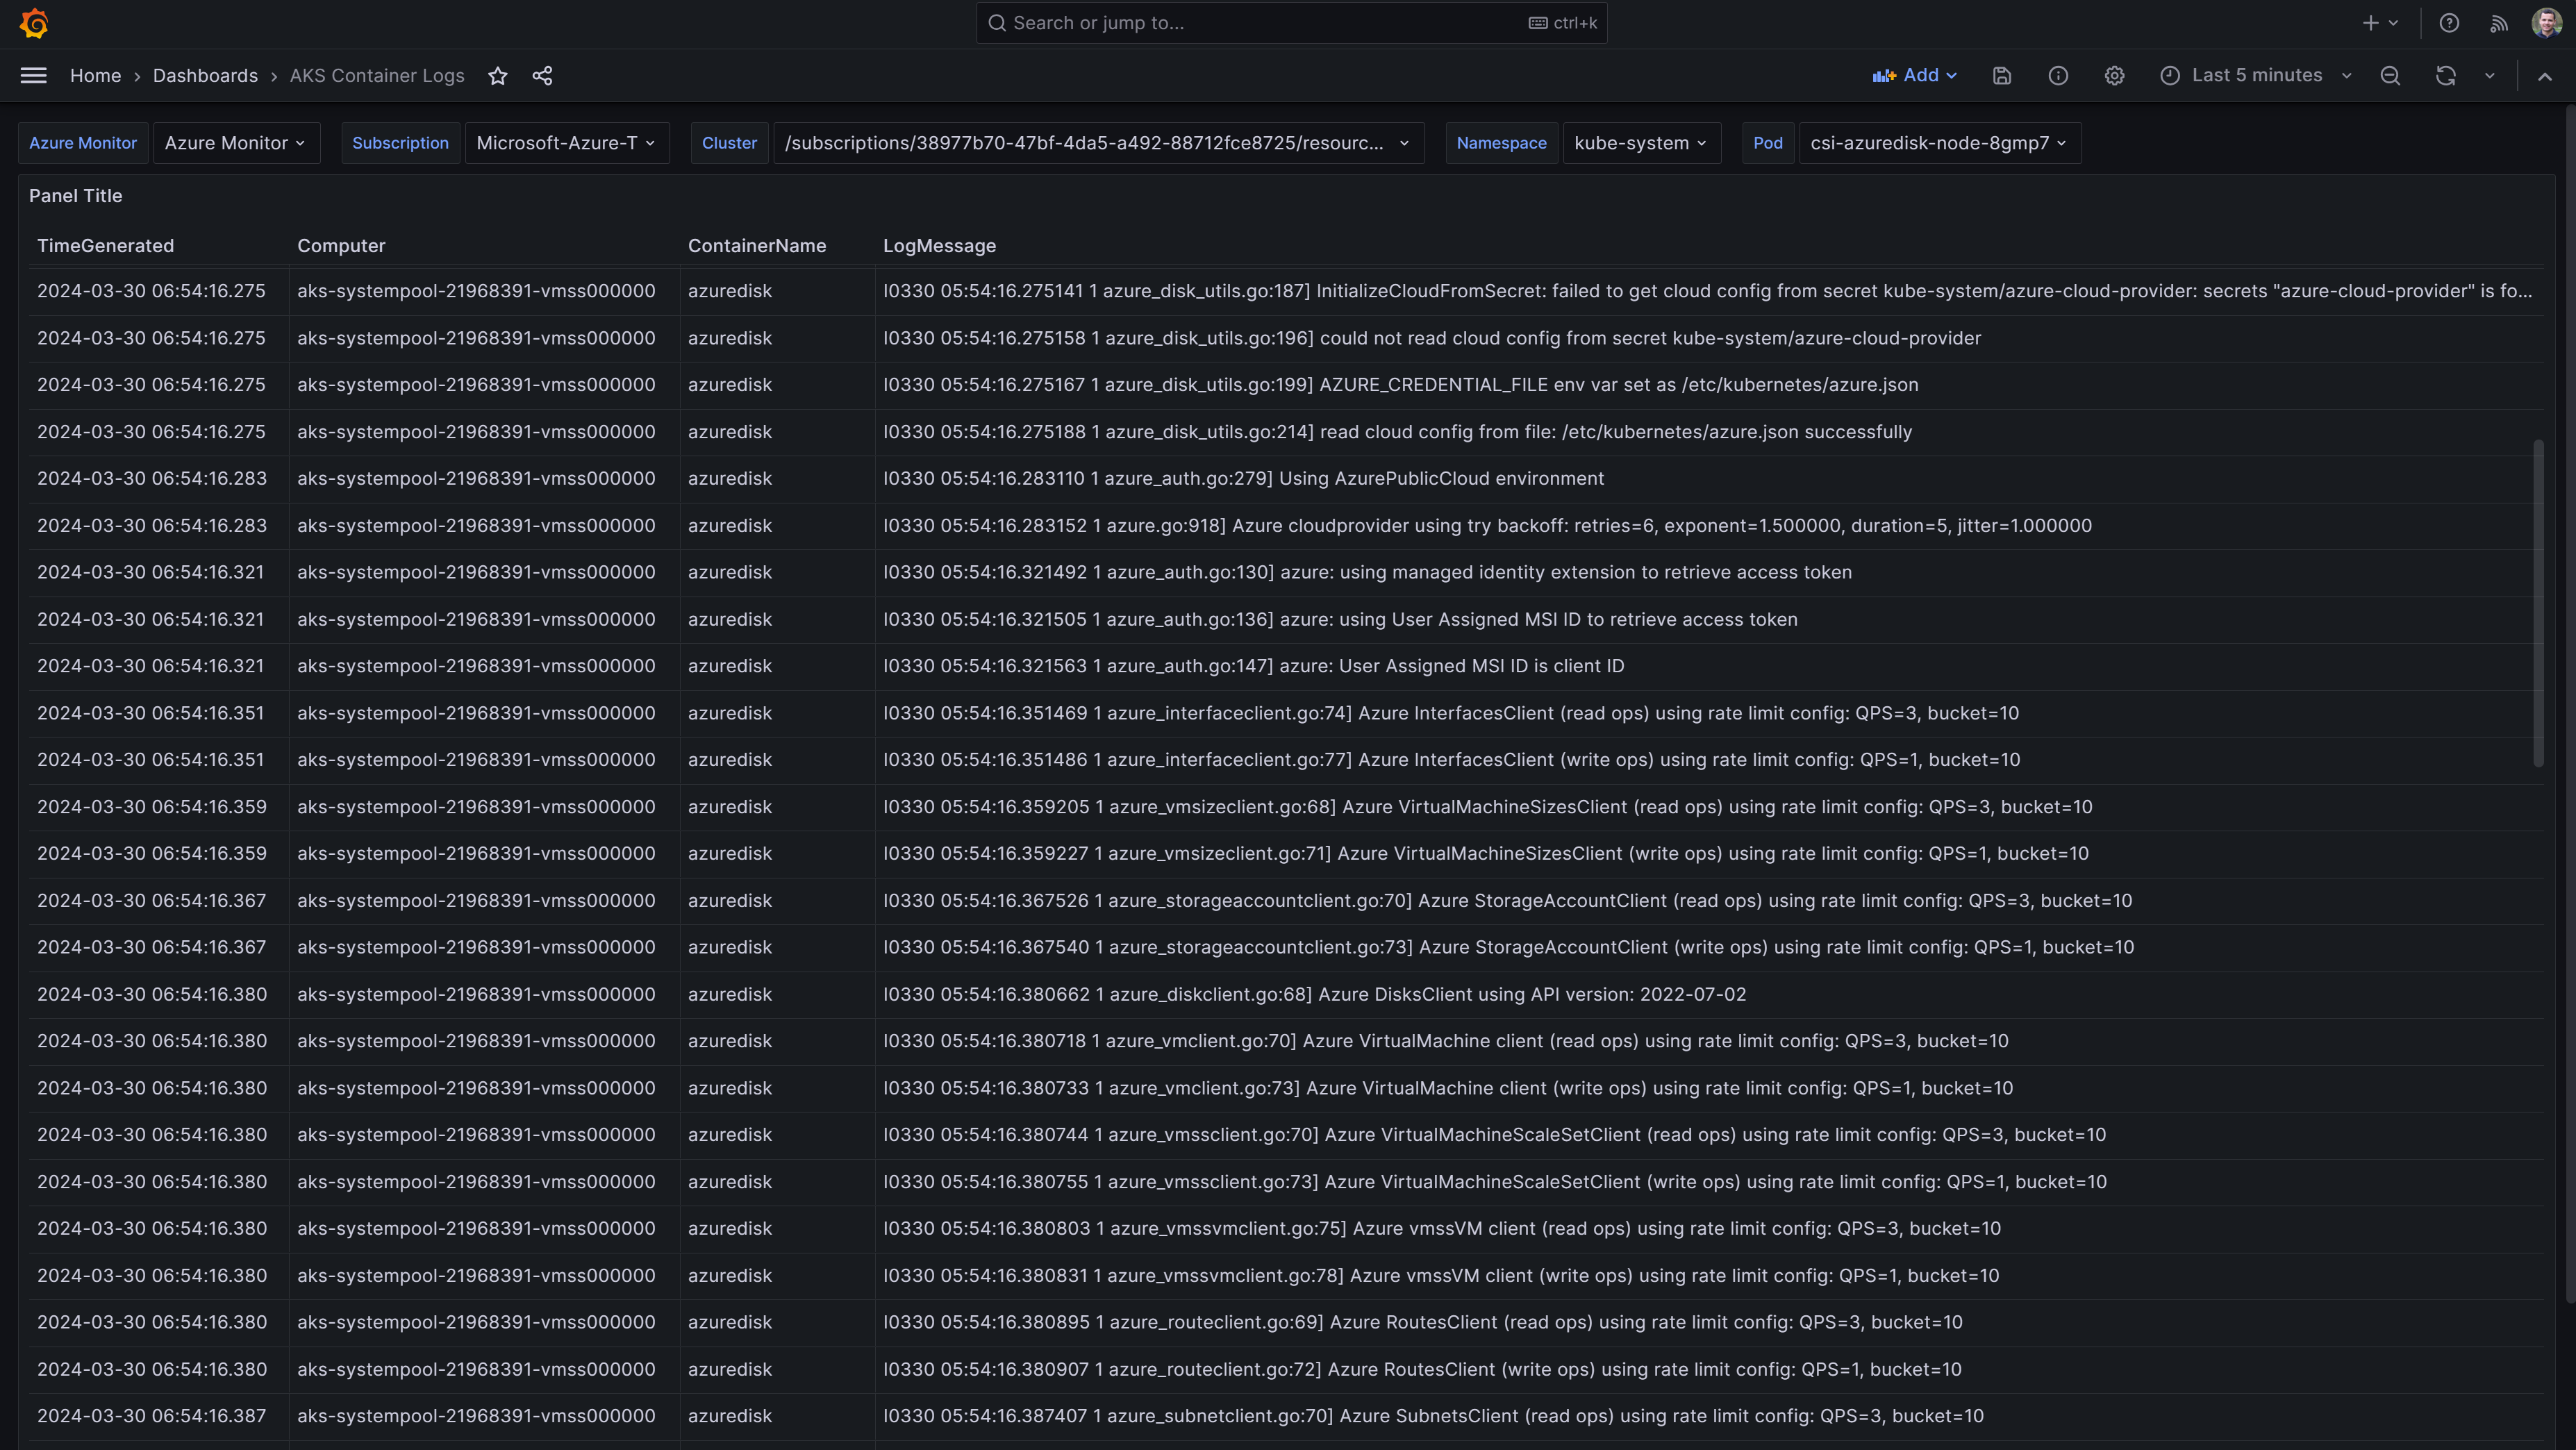
View AKS container logs in Grafana using Azure Monitor data source.
With AKS, you can use Azure Monitor Workspace for Prometheus and Azure Managed Grafana to collect, query and visualize the metrics from AKS.
And to collect logs, you can use Azure Log Analytics.
It is not common to use Grafana to visualize logs, but, technically it is possible !
And it is also useful for two reasons:
- Use the same tool to look for metrics and logs, even in the same dashboard
Azure Managed Grafanahave by default access toAzure Monitorwhich contains the logs
Data source config
Collector type:
Collector plugins:
Collector config:
Revisions
Upload an updated version of an exported dashboard.json file from Grafana
| Revision | Description | Created | |
|---|---|---|---|
| Download |
Grafana Loki (self-hosted)
Easily monitor Grafana Loki (self-hosted), a horizontally scalable, highly available, multi-tenant log aggregation system inspired by Prometheus, with Grafana Cloud's out-of-the-box monitoring solution.
Learn more