Airflow DAG dashboard
https://github.com/databand-ai/airflow-dashboards, with multi cluster support
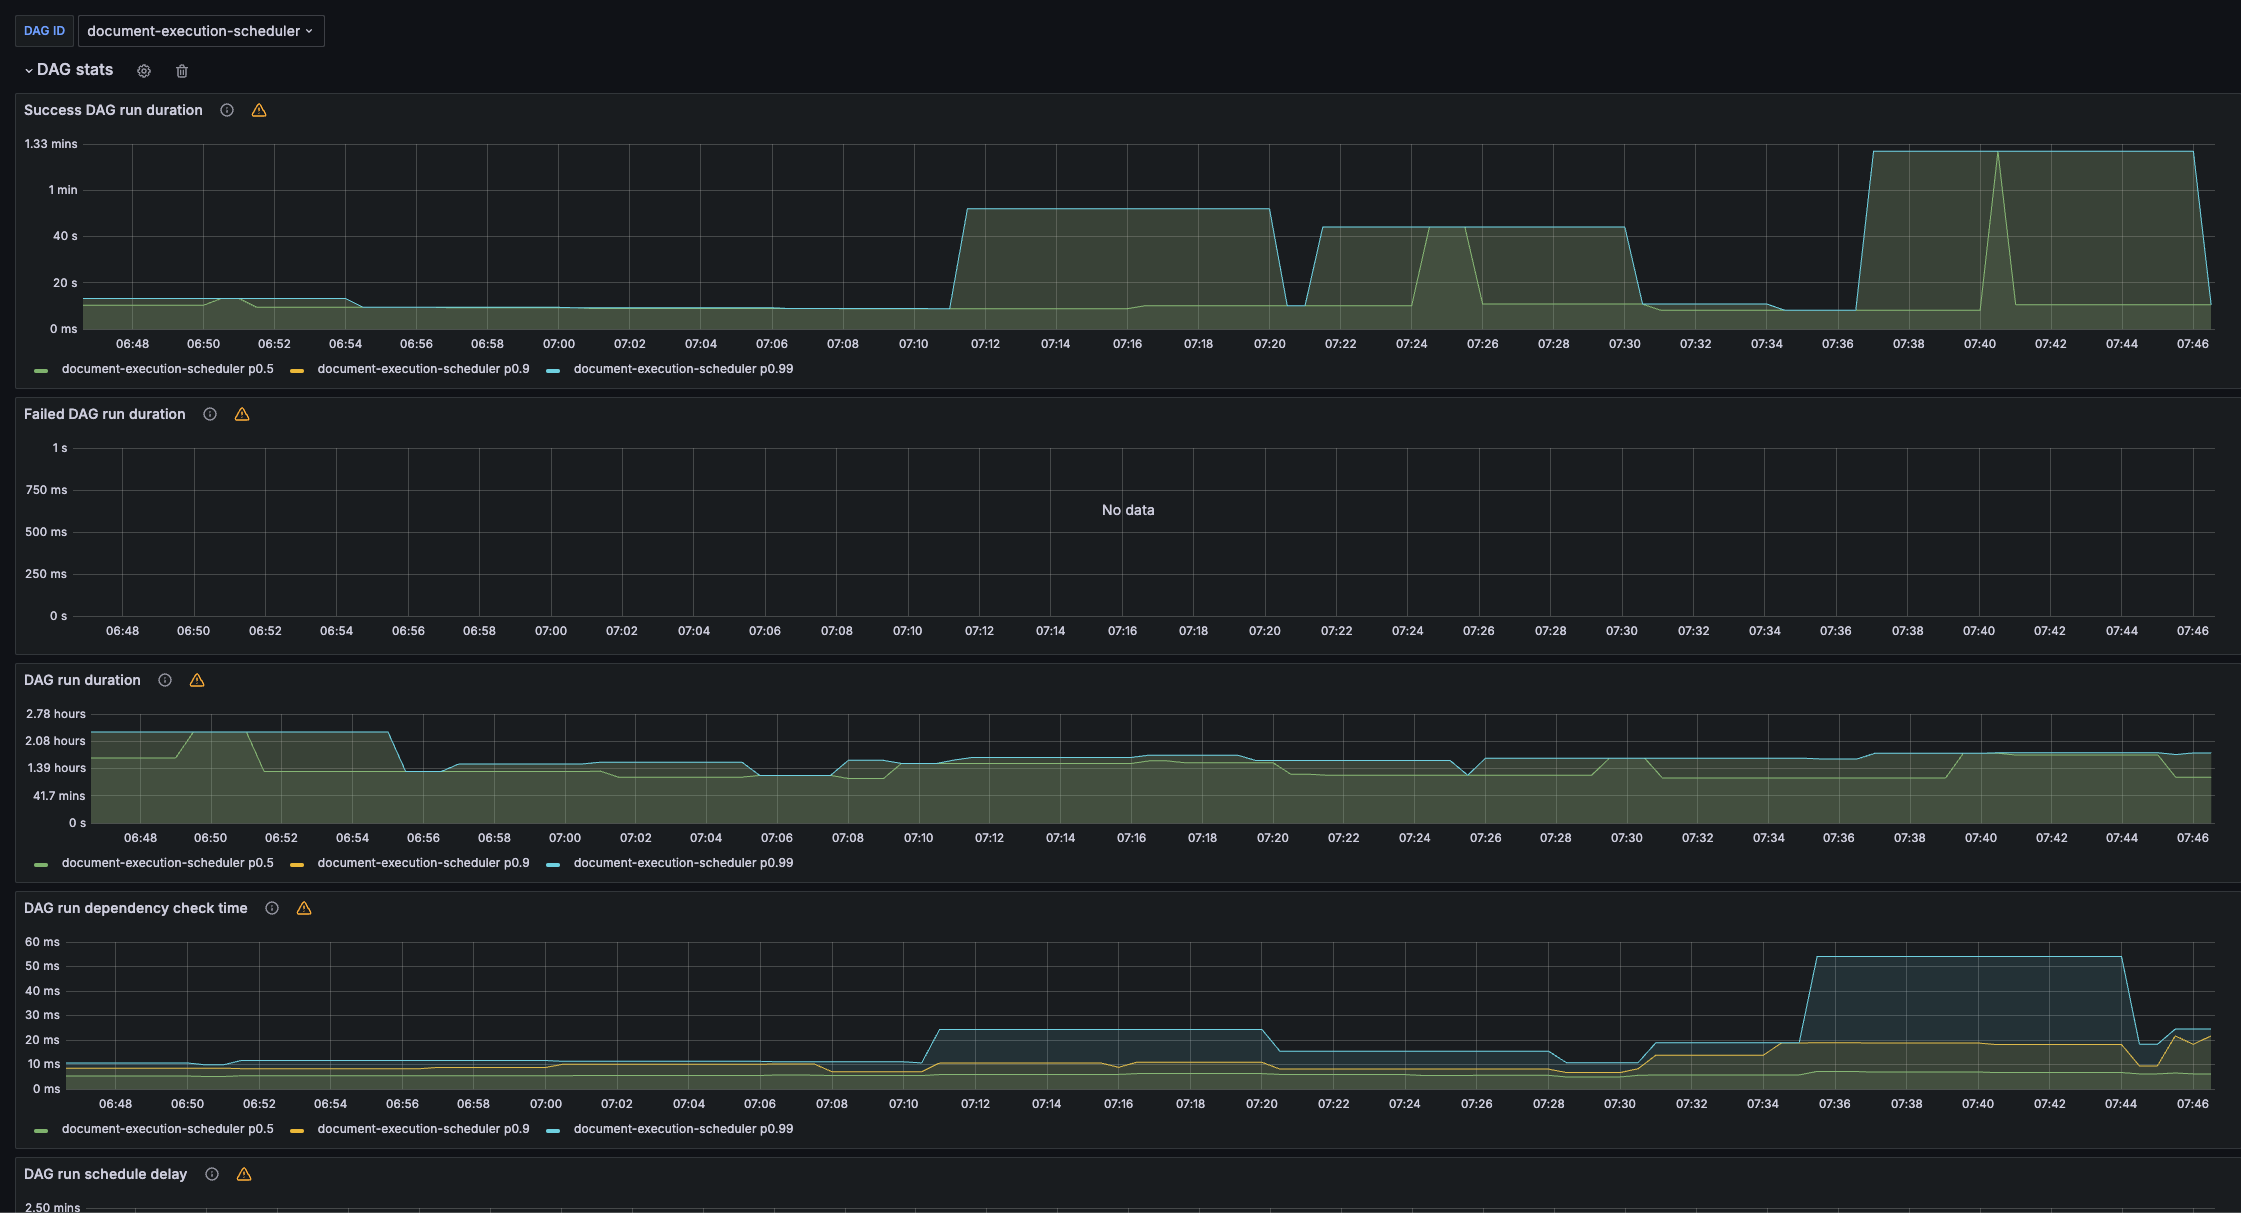
The Airflow DAG dashboard dashboard uses the prometheus data source to create a Grafana dashboard with the timeseries panel.
Data source config
Collector type:
Collector plugins:
Collector config:
Revisions
Upload an updated version of an exported dashboard.json file from Grafana
| Revision | Description | Created | |
|---|---|---|---|
| Download |
Apache Airflow
Easily monitor Apache Airflow, an open source platform for programmatically authoring, scheduling, and monitoring workflows, with Grafana Cloud's out-of-the-box monitoring solution.
Learn more