
Borgmatic Logs
Borgmatic Logs & Stats
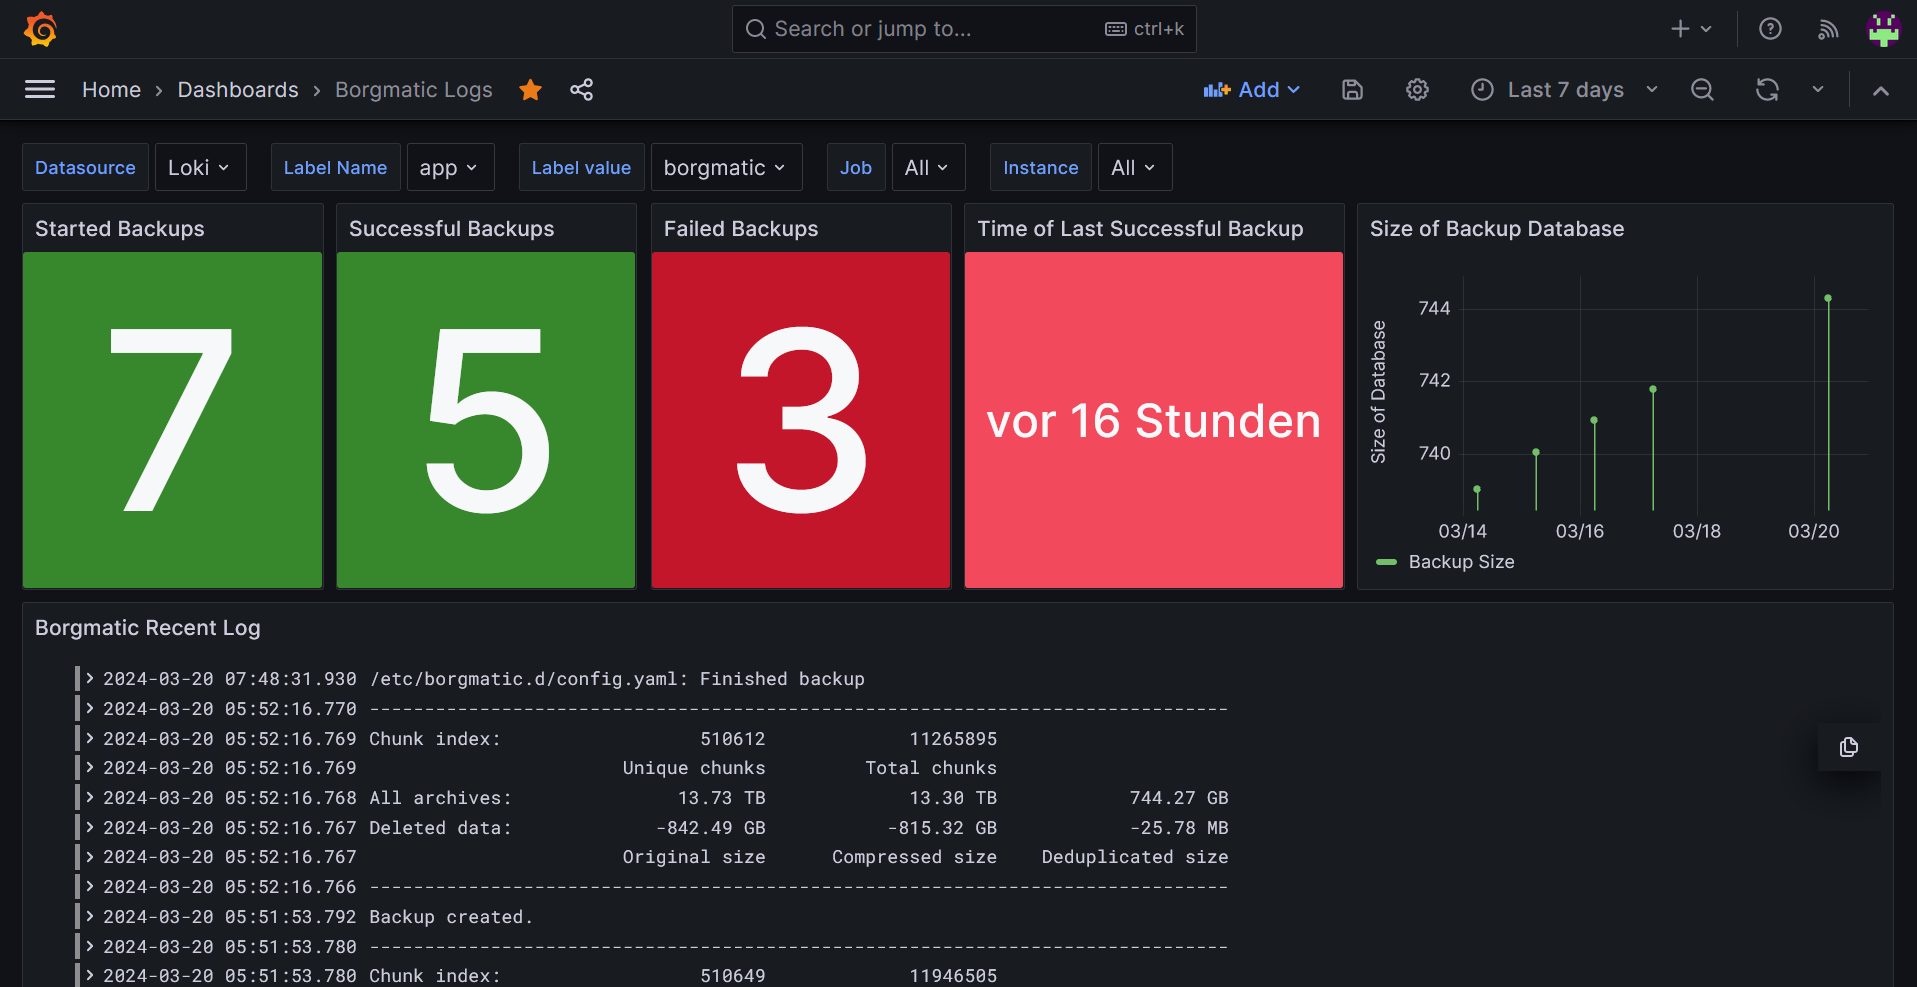
This Dashboard uses the loki functionality in borgamatic. You need a separate loki instance running to serve the data for Grafana. You can rename the labels to arbitrary values - the Dashboard supports selection based on labels.
Just make sure to leave the print statements in before_backup, after_backup and on_error untouched. These are used for statistics.
This is the config.yml I use with borgmatic:
source_directories:
    - /mnt/source
repositories:
    - path: /mnt/borg-repository
      label: local
one_file_system: true
encryption_passphrase is set in variable $BORG_PASSPHRASE
compression: lz4
archive_name_format: 'backup-{now}'
retention policy
keep_daily: 7
keep_weekly: 4
keep_monthly: 12
keep_yearly: 10
consistency:
checks:
- name: repository
- name: archives
check_last: 3
before_backup:
- echo "Starting a backup job."
after_backup:
- echo "Backup created."
on_error:
- echo "Error while creating a backup."
loki:
url: http://my-loki-instance:3100/loki/api/v1/push
labels:
instance: borgmatic
env: home-production
app: borgmatic
hostname: __hostname
Data source config
Collector config:
Upload an updated version of an exported dashboard.json file from Grafana
| Revision | Description | Created | |
|---|---|---|---|
| Download |
Grafana Loki (self-hosted)
Easily monitor Grafana Loki (self-hosted), a horizontally scalable, highly available, multi-tenant log aggregation system inspired by Prometheus, with Grafana Cloud's out-of-the-box monitoring solution.
Learn more