Spring Boot JDBC & HikariCP
Spring Boot (Micrometer) with JDBC and HikariCP.
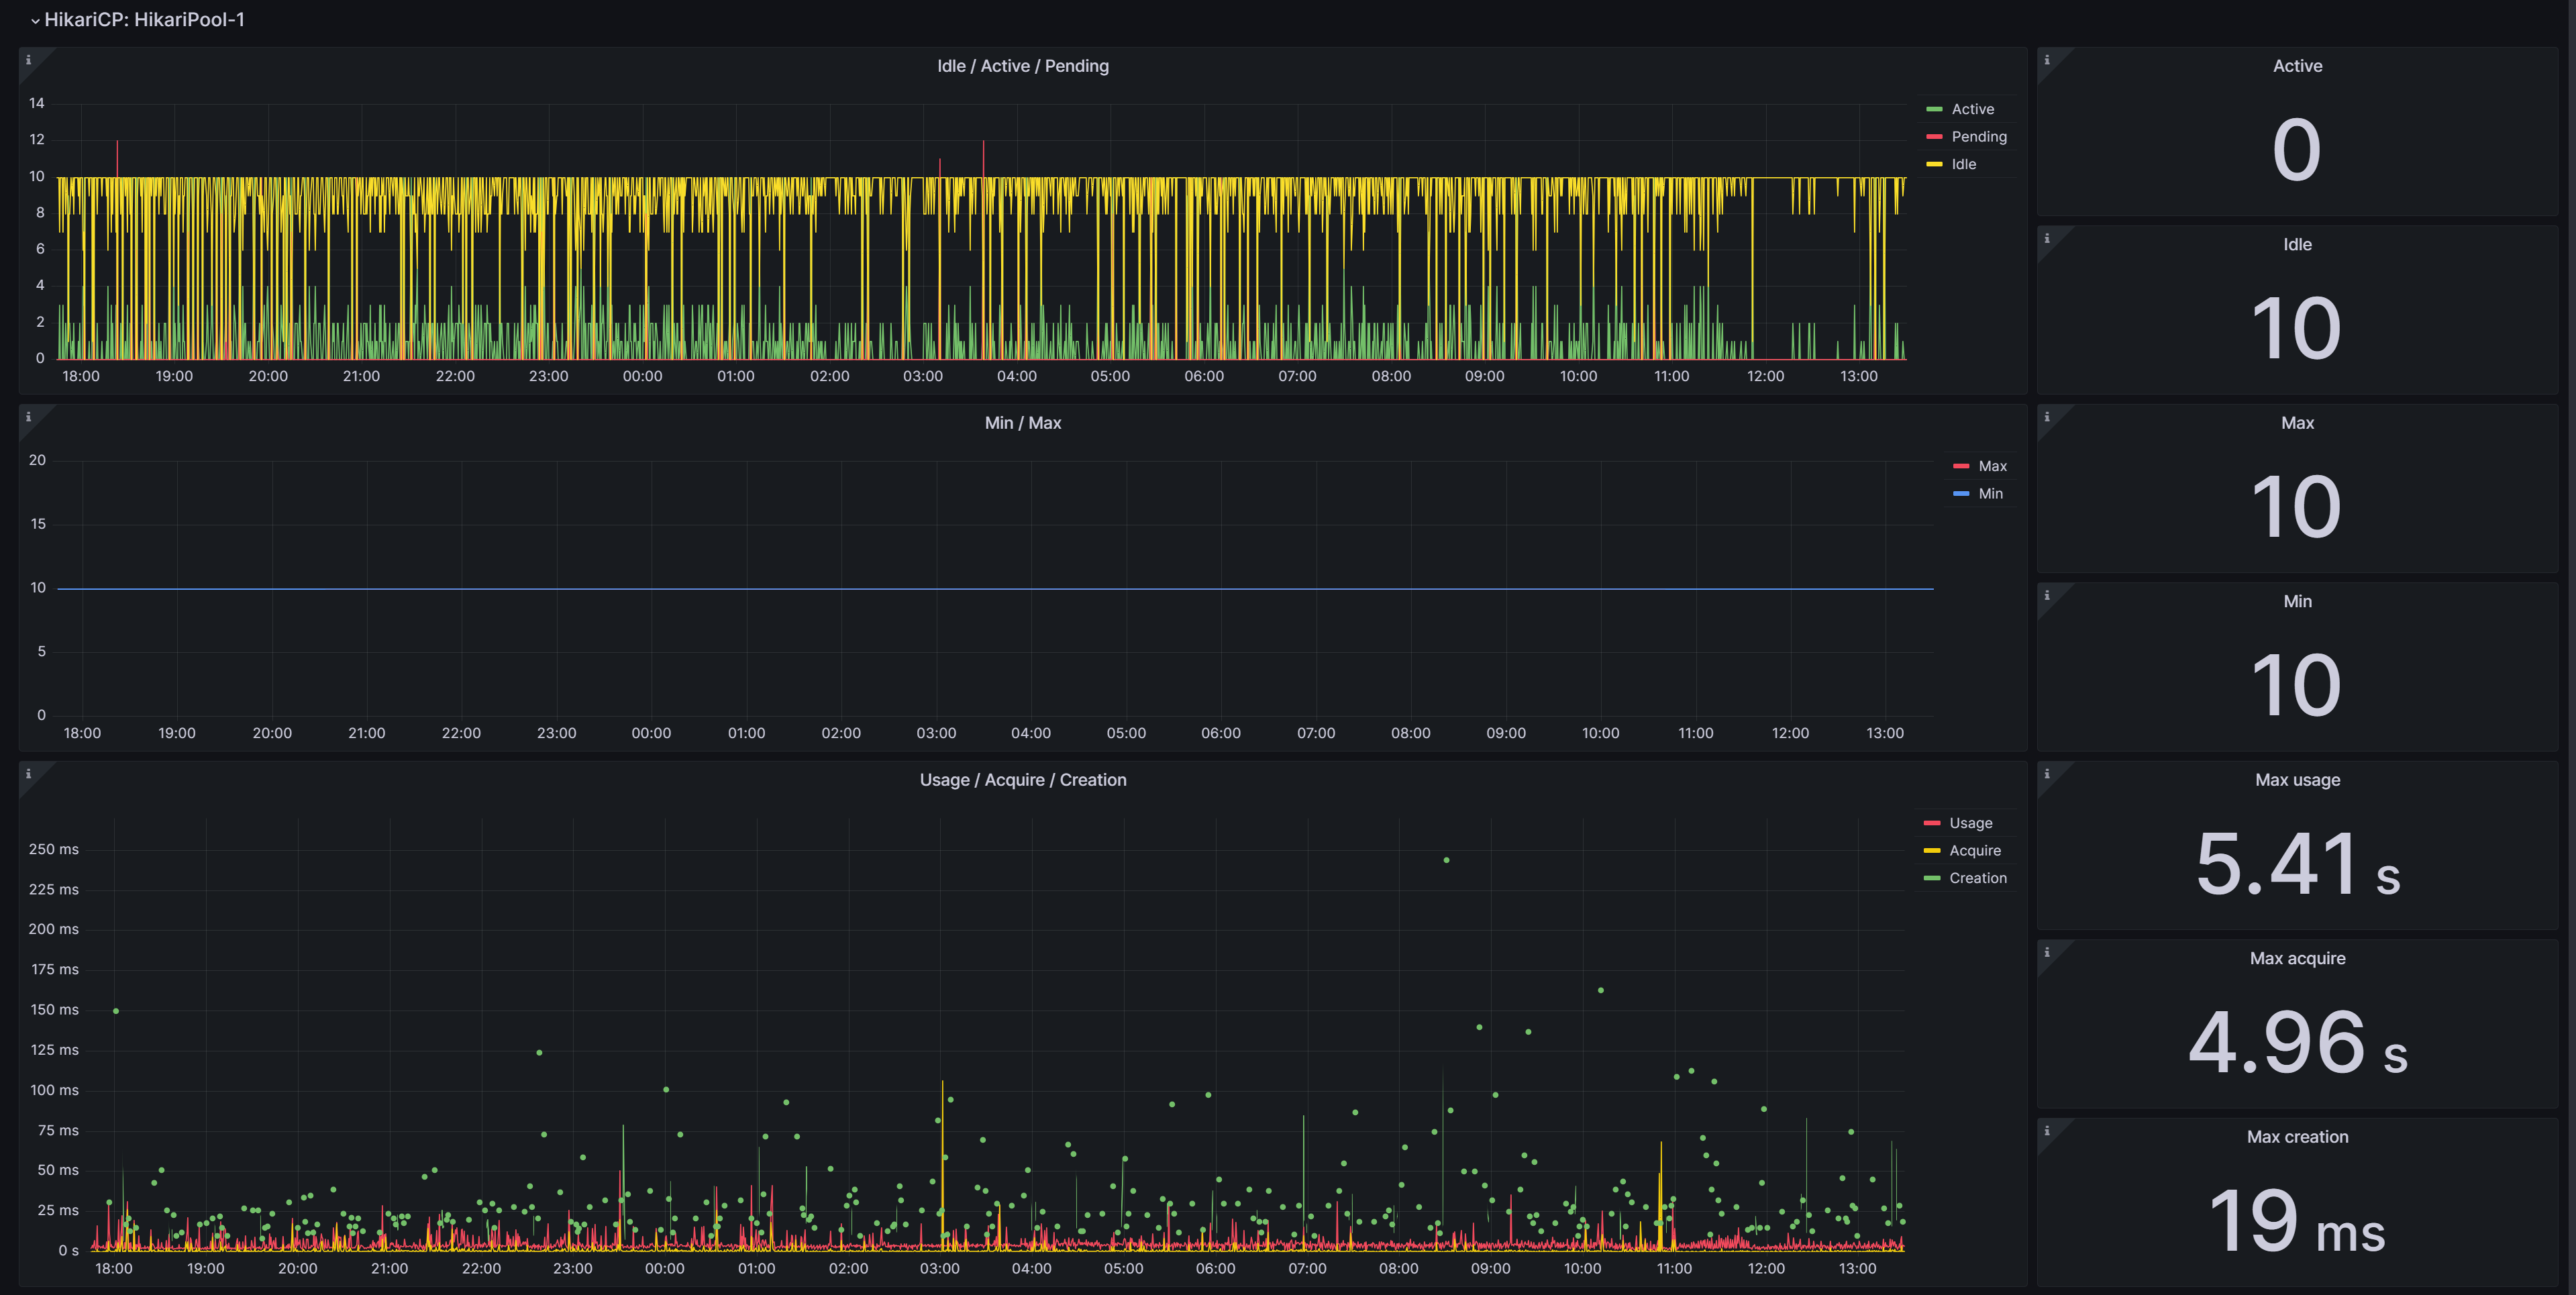
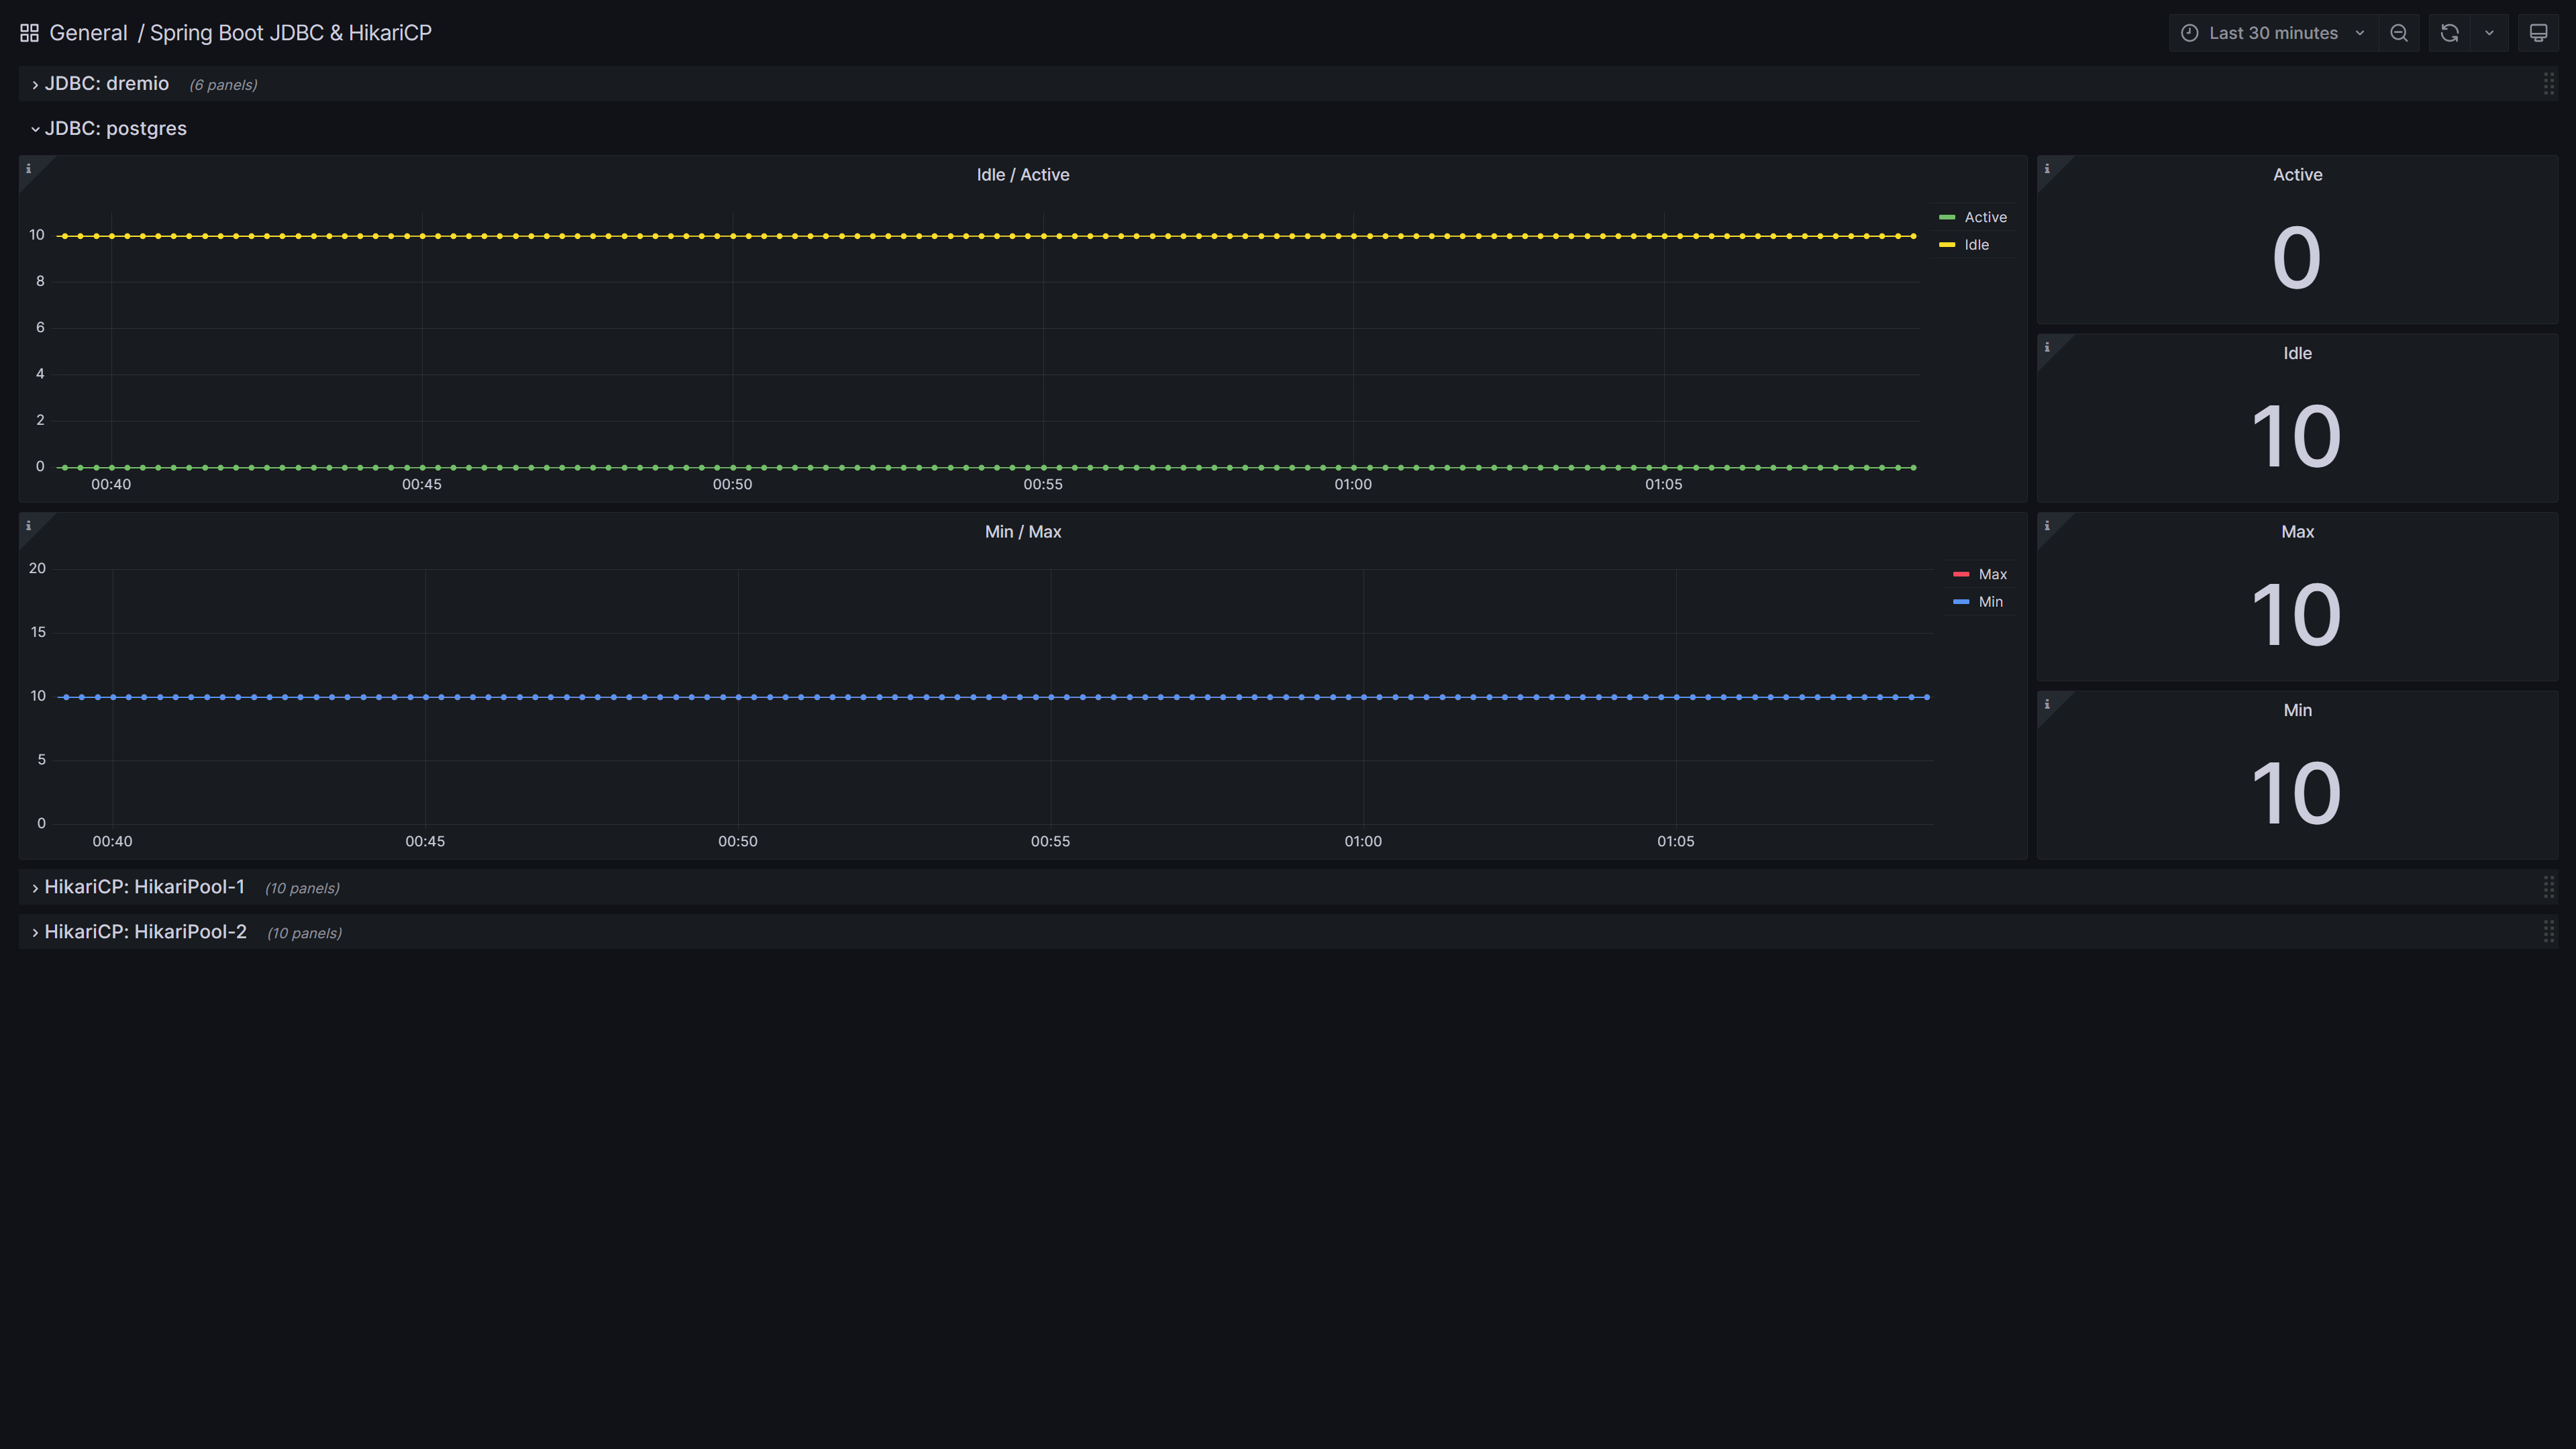
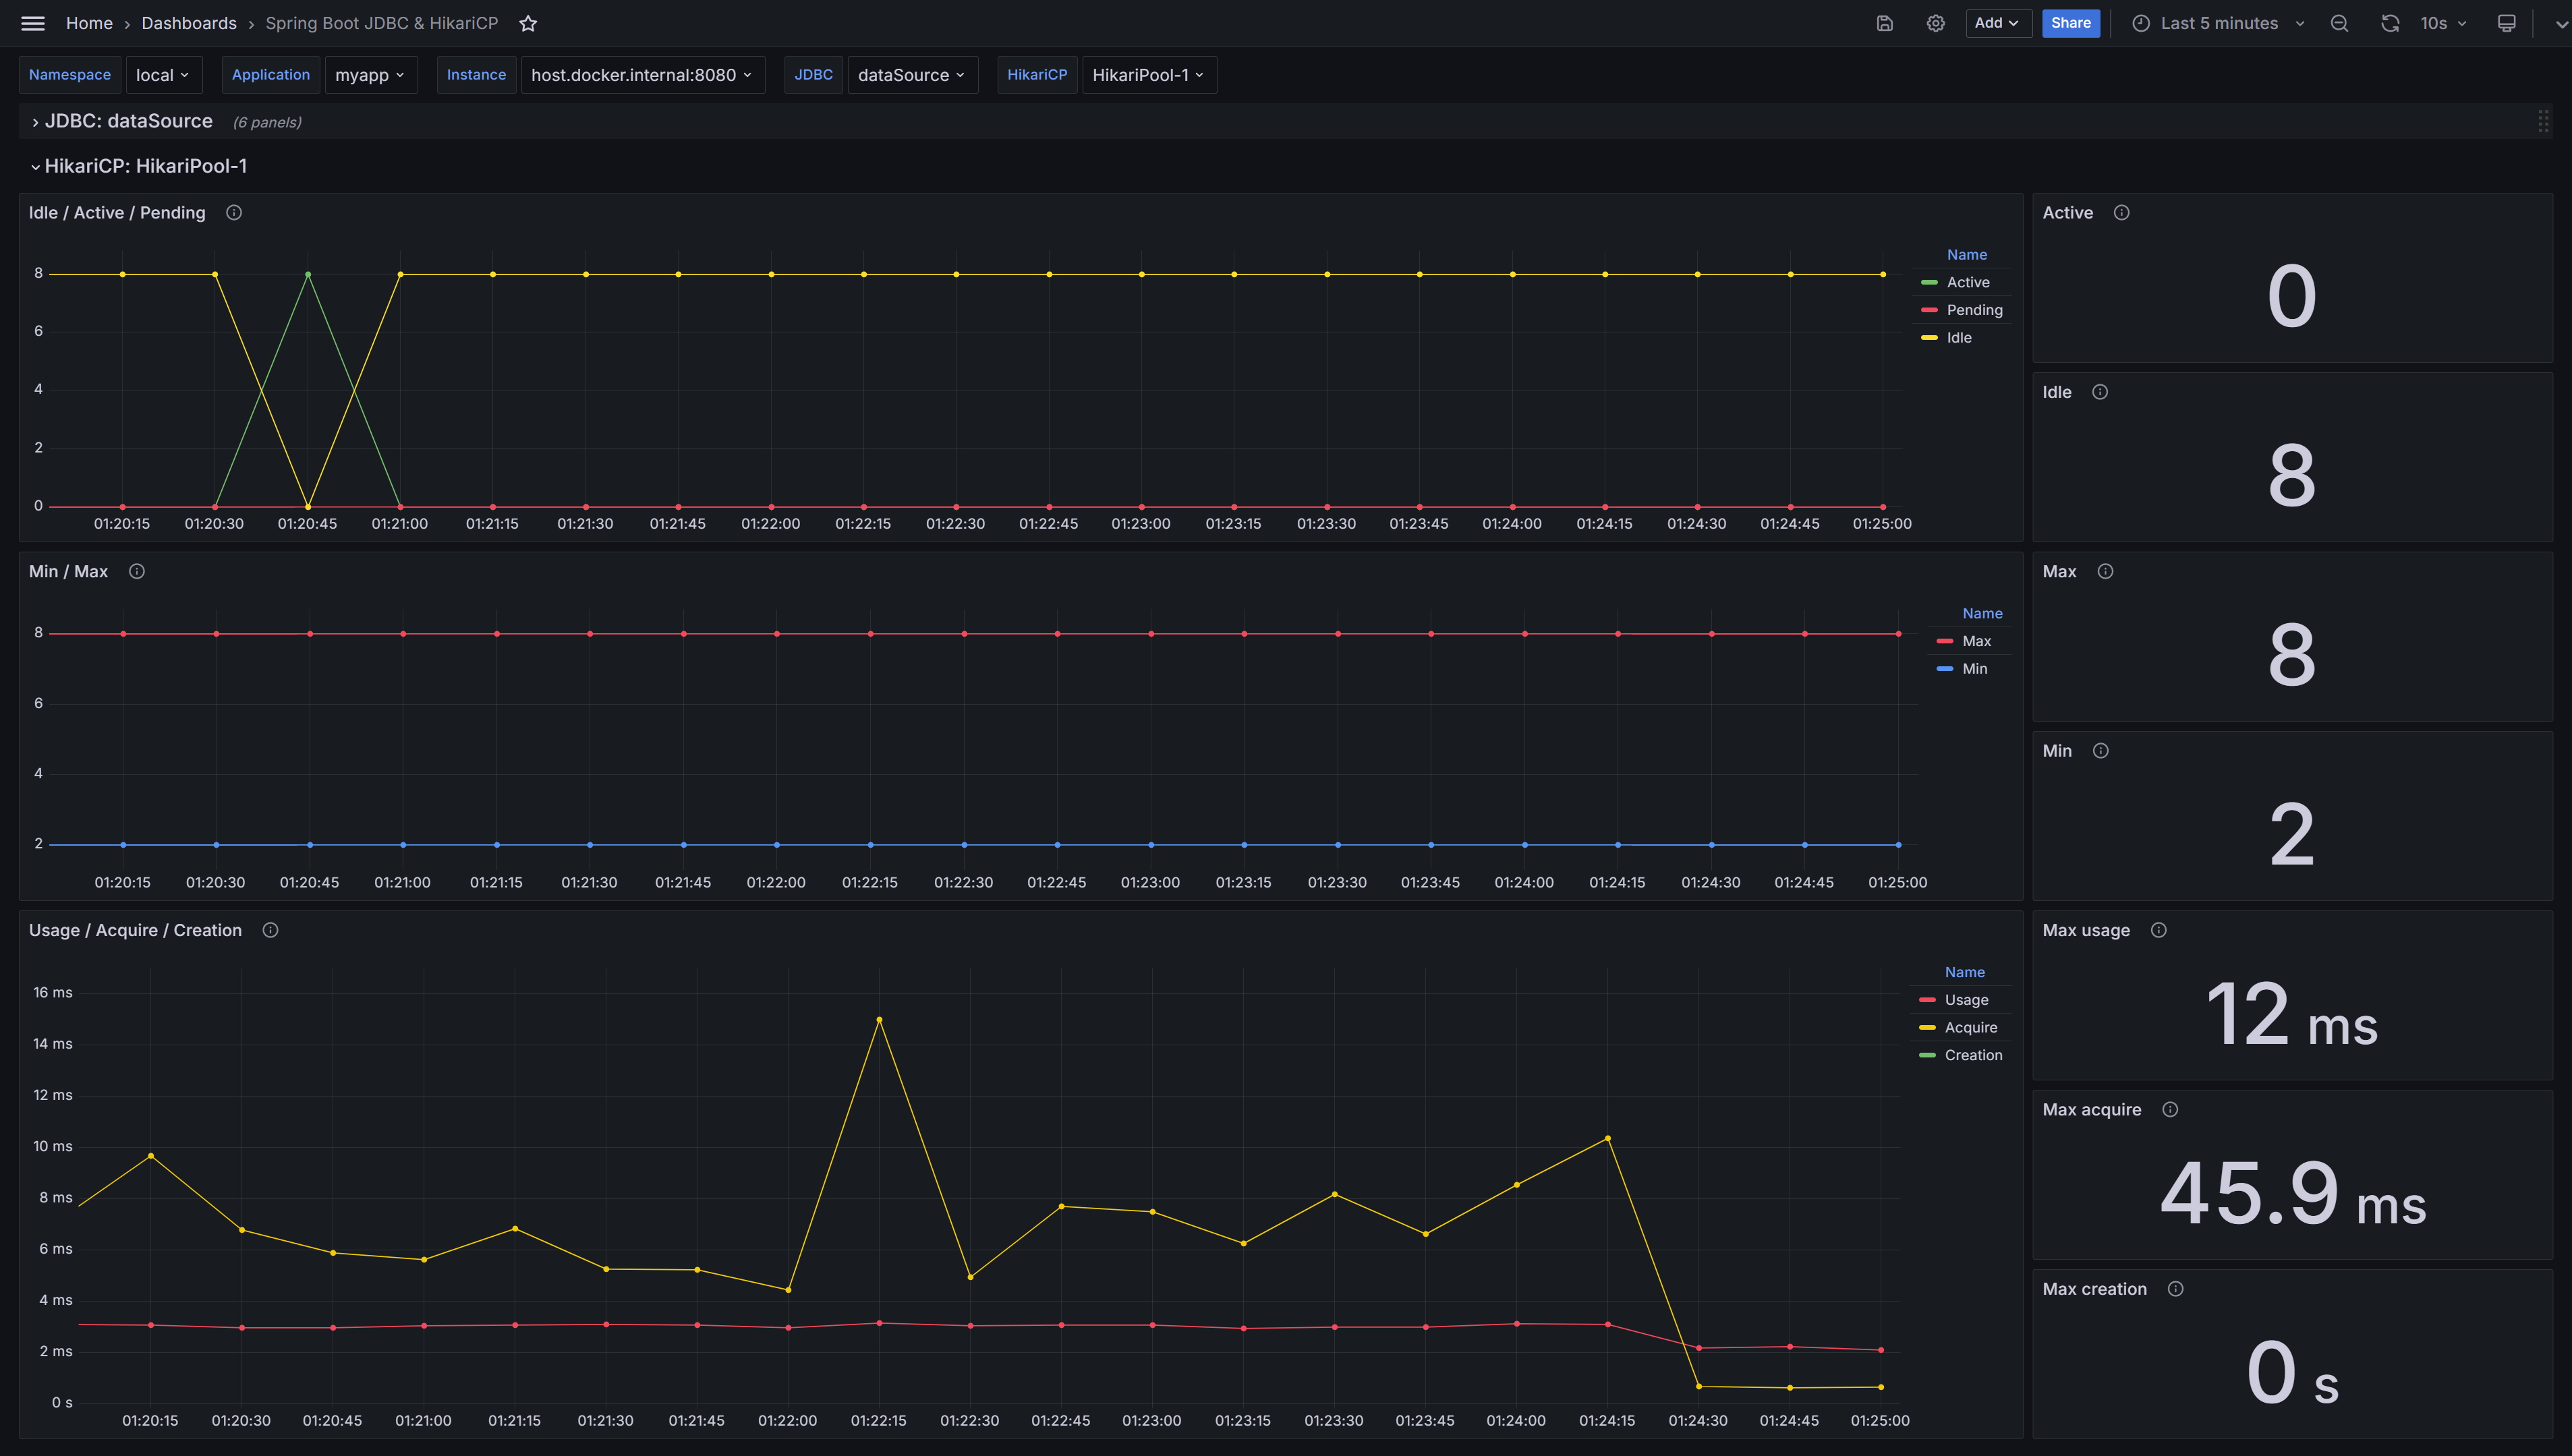
Spring Boot JDBC & HikariCP
Grafana Dashboard of Spring Boot (by Micrometer metrics from Prometheus) for JDBC and HikariCP.
Supported Spring Boot 3.x.
See details in GitHub.
Configure Spring Boot Application
- Add one of Spring Boot database modules, for example, Spring Data Jpa or Spring Data JDBC.
- Add Spring Boot Actuator module with micrometer-registry-prometheus.
- Add configuration, for example,
application.yml:
spring:
  application:
    name: myapp
  datasource:
    username: mydb_user
    password: mydb_pass
    url: jdbc:postgresql://localhost:5432/mydb
    hikari:
      minimum-idle: 2
      maximum-pool-size: 8
management:
  endpoints:
    web:
      exposure:
        include:
          - prometheus # Access by /actuator/prometheus
  metrics:
    tags:
      namespace: local # Namespace of k8s
      application: ${spring.application.name}
Configure Prometheus Job
Add job with pulling metrics from /actuator/prometheus,
for example, on localhost:8080:
scrape_configs:
  - job_name: myapp-job
    scrape_interval: 15s
    metrics_path: /actuator/prometheus
    static_configs:
      - targets: [ localhost:8080 ]
Data source config
Collector type:
Collector plugins:
Collector config:
Revisions
Upload an updated version of an exported dashboard.json file from Grafana
| Revision | Description | Created | |
|---|---|---|---|
| Download |
Spring Boot
Easily monitor Spring Boot with Grafana Cloud's out-of-the-box monitoring solution.
Learn more