Internal Kubernetes Routes
Monitor Routes from one Node to another
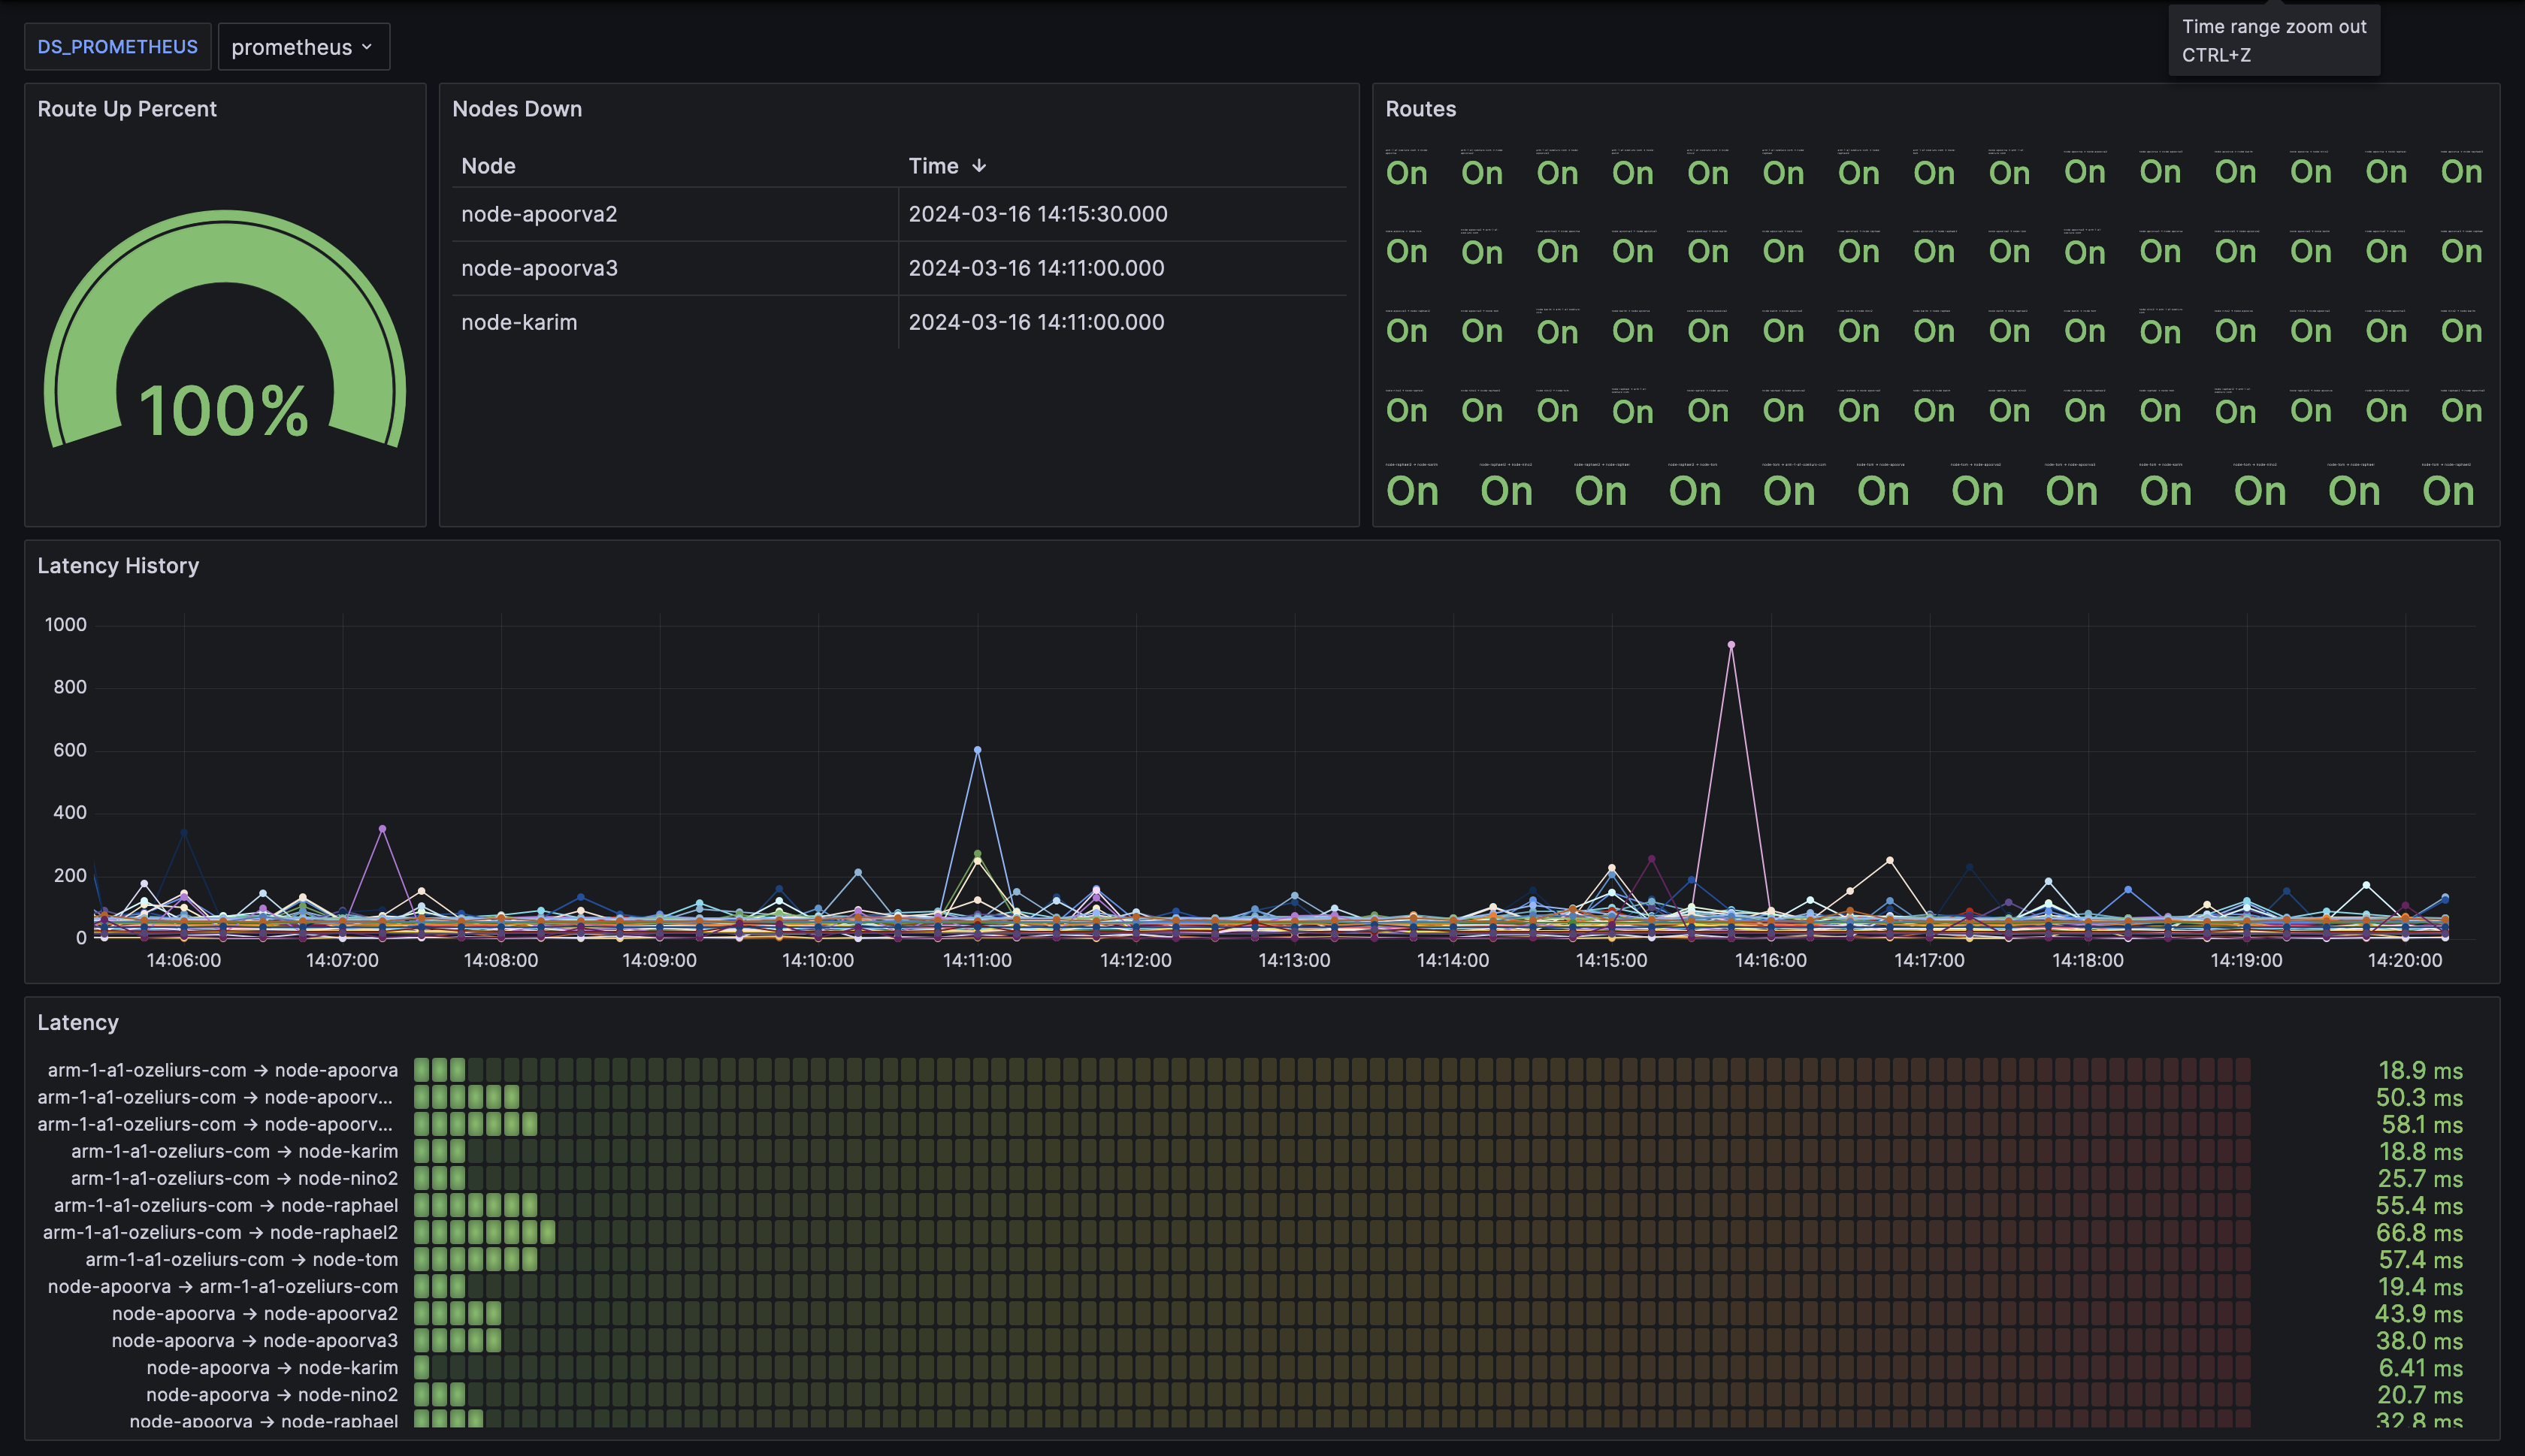
The Grafana dashboard for the Network Checker App provides clear, real-time insights into your Kubernetes cluster's network performance. It includes:
Overview: Get a quick glance at network latency and availability metrics.
Node Connectivity: Visualize connectivity between nodes.
Customizable Metrics: Tailor metrics to your monitoring needs.
Real-time Updates: Stay informed with dynamic, up-to-date data.
Alerting: Set up alerts for immediate issue notification.
Scalability Monitoring: Monitor network as your cluster grows.
Install the exporter at https://github.com/Apoorva64/network-check
Data source config
Collector type:
Collector plugins:
Collector config:
Revisions
Upload an updated version of an exported dashboard.json file from Grafana
| Revision | Description | Created | |
|---|---|---|---|
| Download |
Kubernetes
Monitor your Kubernetes deployment with prebuilt visualizations that allow you to drill down from a high-level cluster overview to pod-specific details in minutes.
Learn more