RabbitMQ Queues Overview - Seventh State RabbitMQ Support
Overview of all queues in a RabbitMQ Cluster
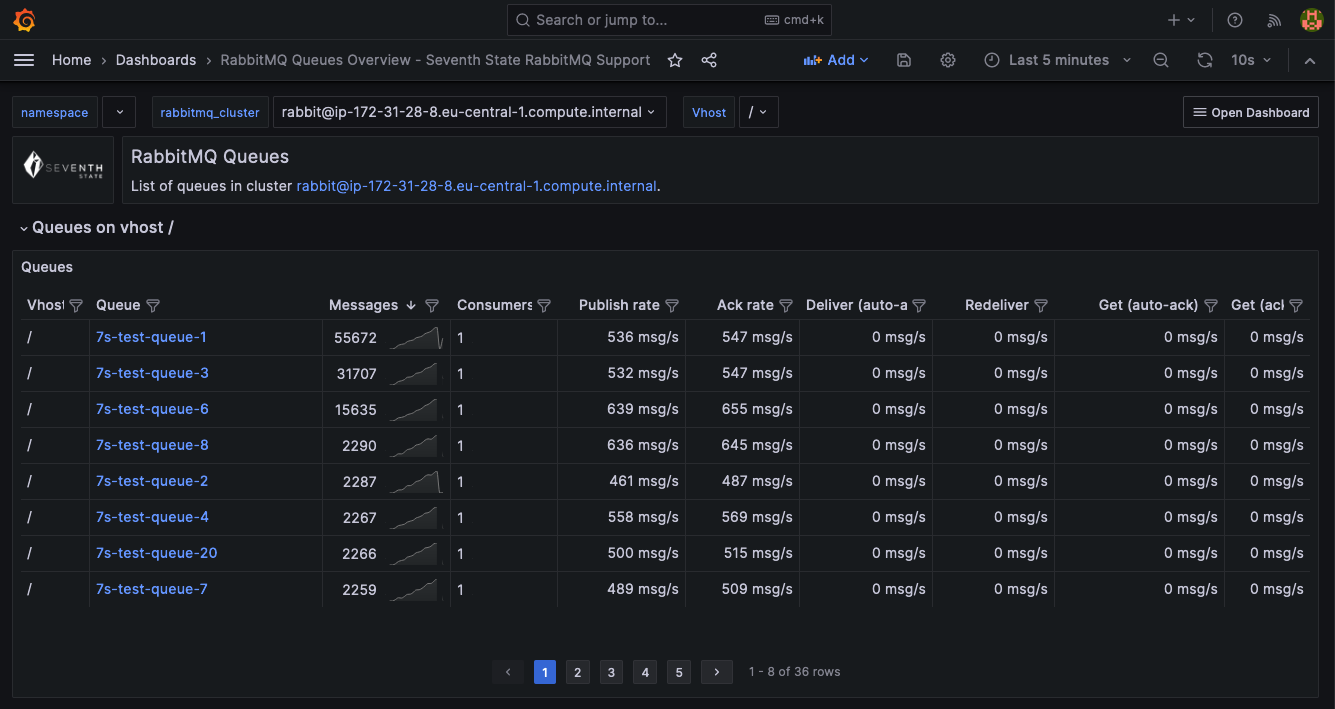
This dashboard gives a detailed view of RabbitMQ queues, displaying real-time metrics like message backlog, publish and delivery rates. It's designed to provide an overview of queue health and ensure messages are being processed.
This dashboard is part of a collection of RabbitMQ Monitoring Dashboards by Seventh State RabbitMQ Support to enhance your monitoring capabilities, leveraging the built in RabbitMQ Prometheus integration.
Discover more and connect with us at Seventh State RabbitMQ Website for RabbitMQ health checks and consultancy: https://seventhstate.io/rabbitmq-monitoring-dashboards
Data source config
Collector config:
Upload an updated version of an exported dashboard.json file from Grafana
| Revision | Description | Created | |
|---|---|---|---|
| Download |
RabbitMQ
Easily monitor RabbitMQ, the most widely deployed open source message broker, with Grafana Cloud's out-of-the-box monitoring solution.
Learn more