Gitlab Runner - Docker Executor
Metrics from gitlab runners
Gitlab Runner - Docker Executor
Introduction
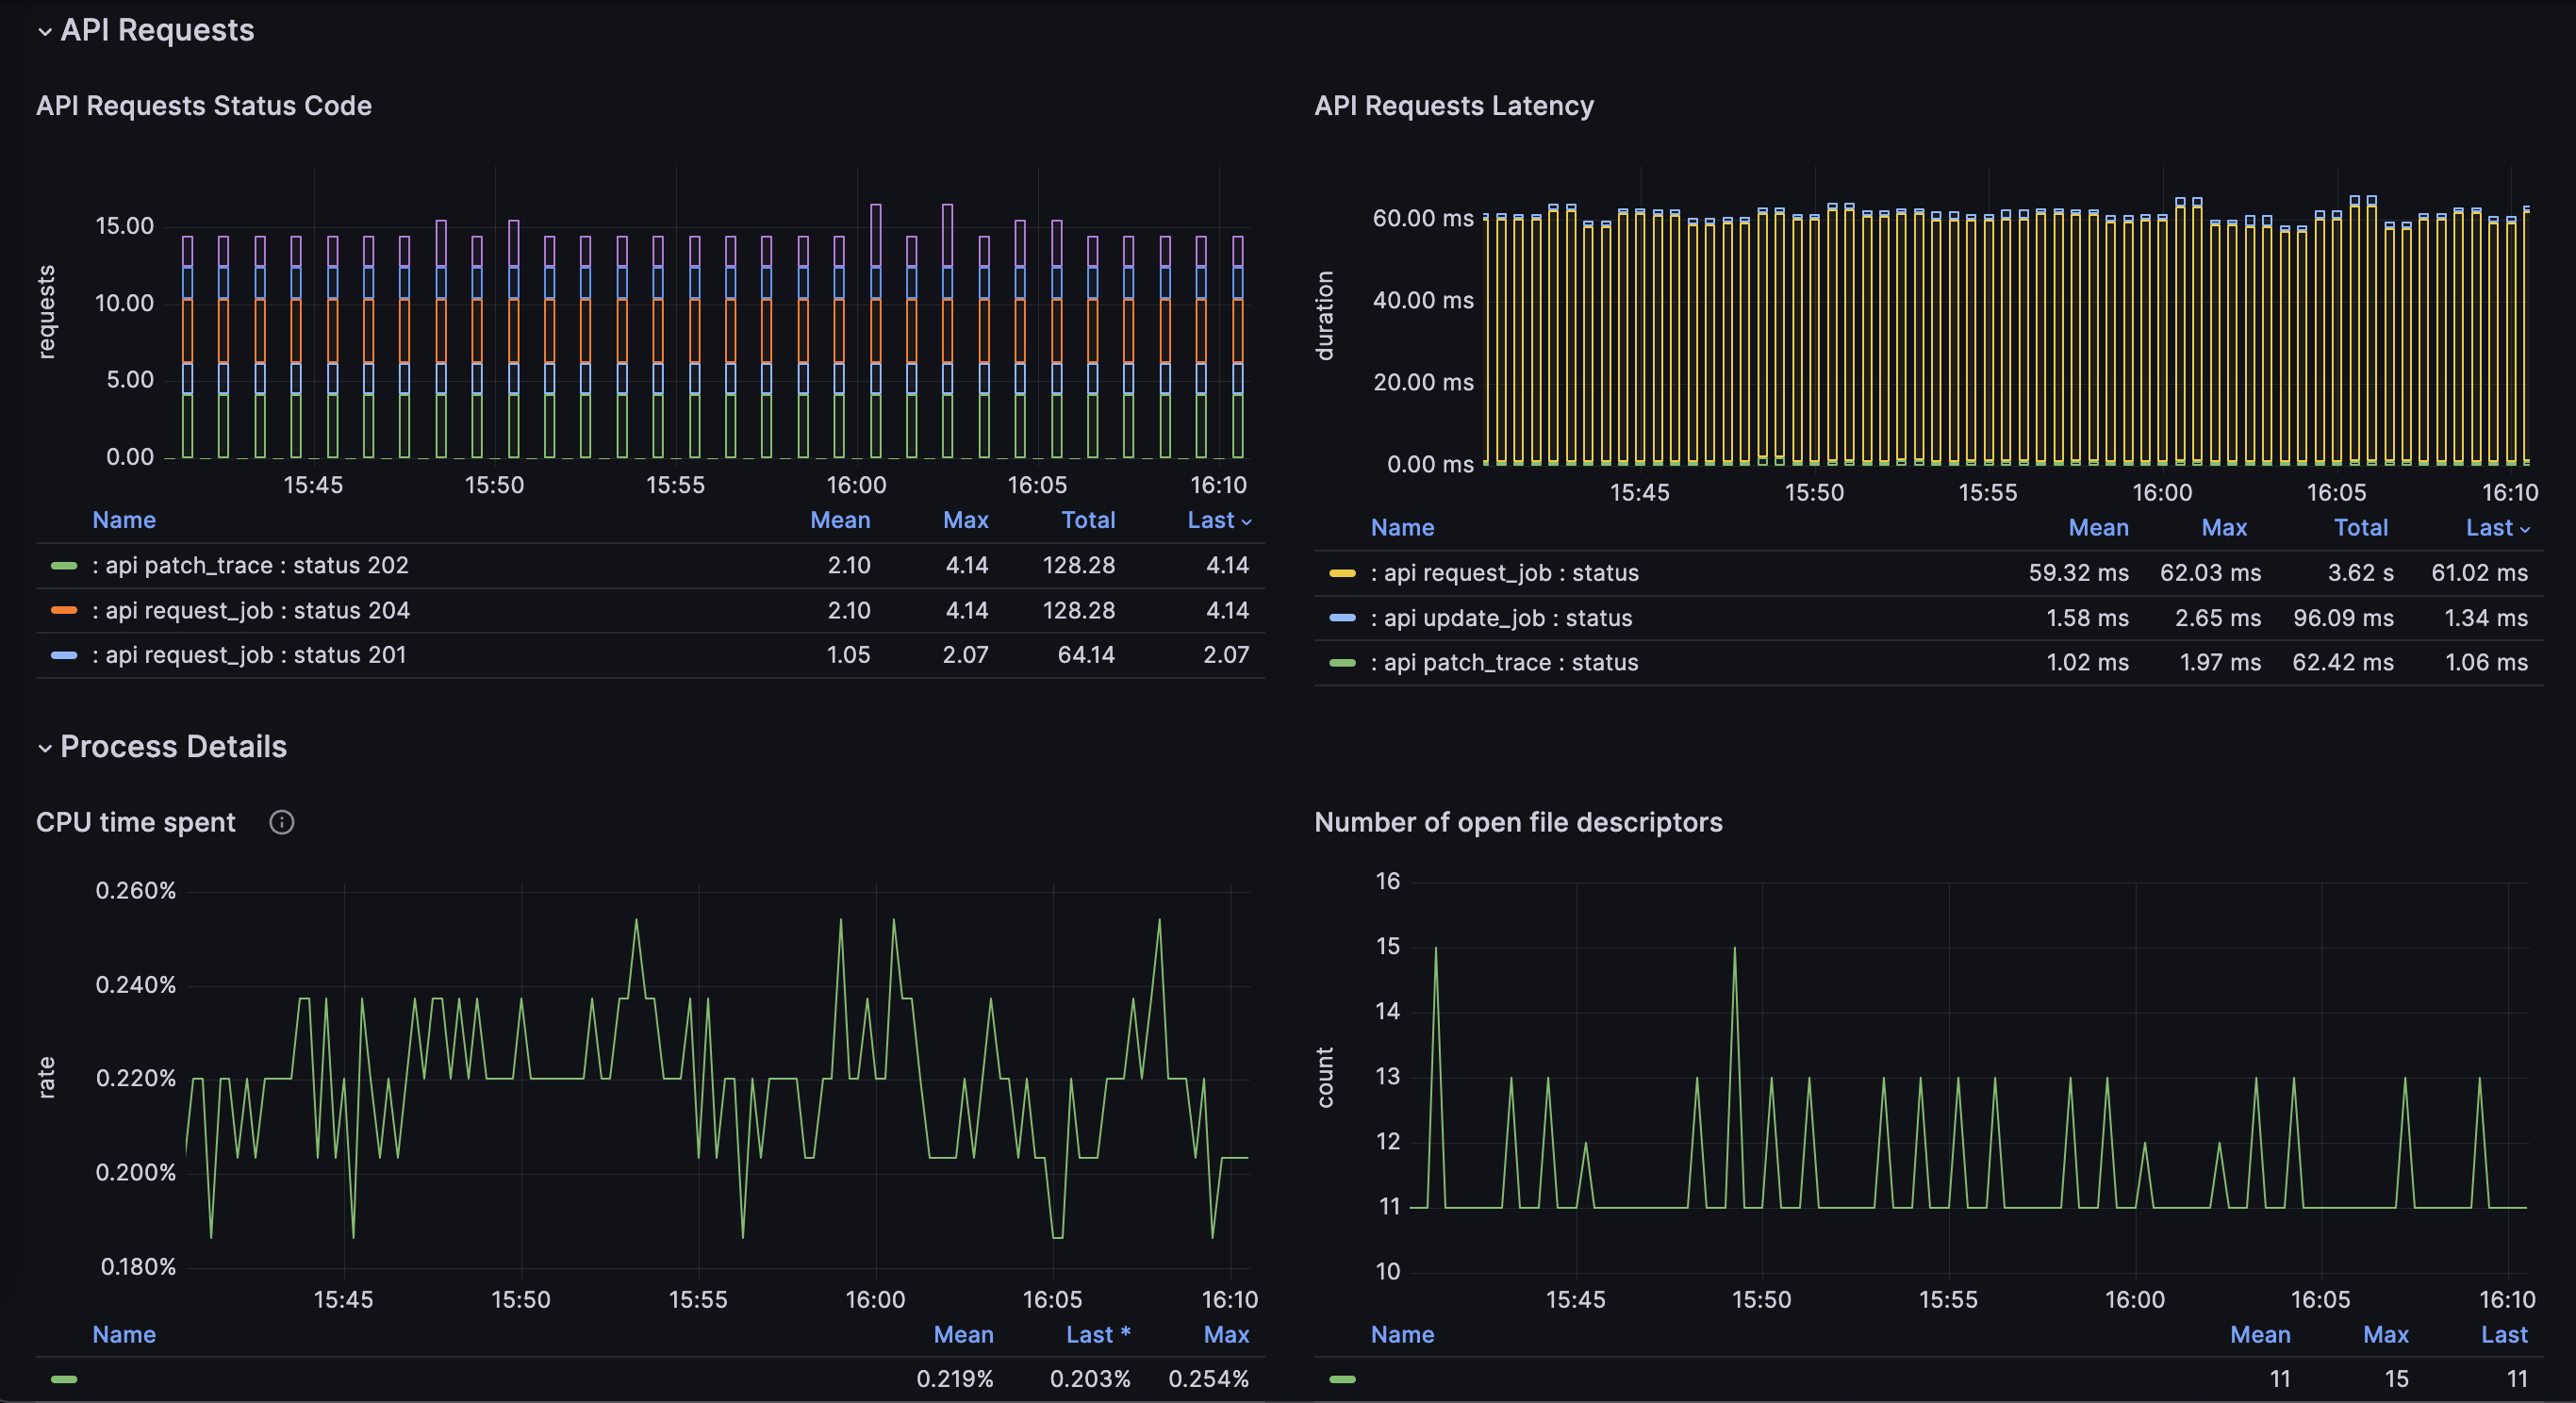
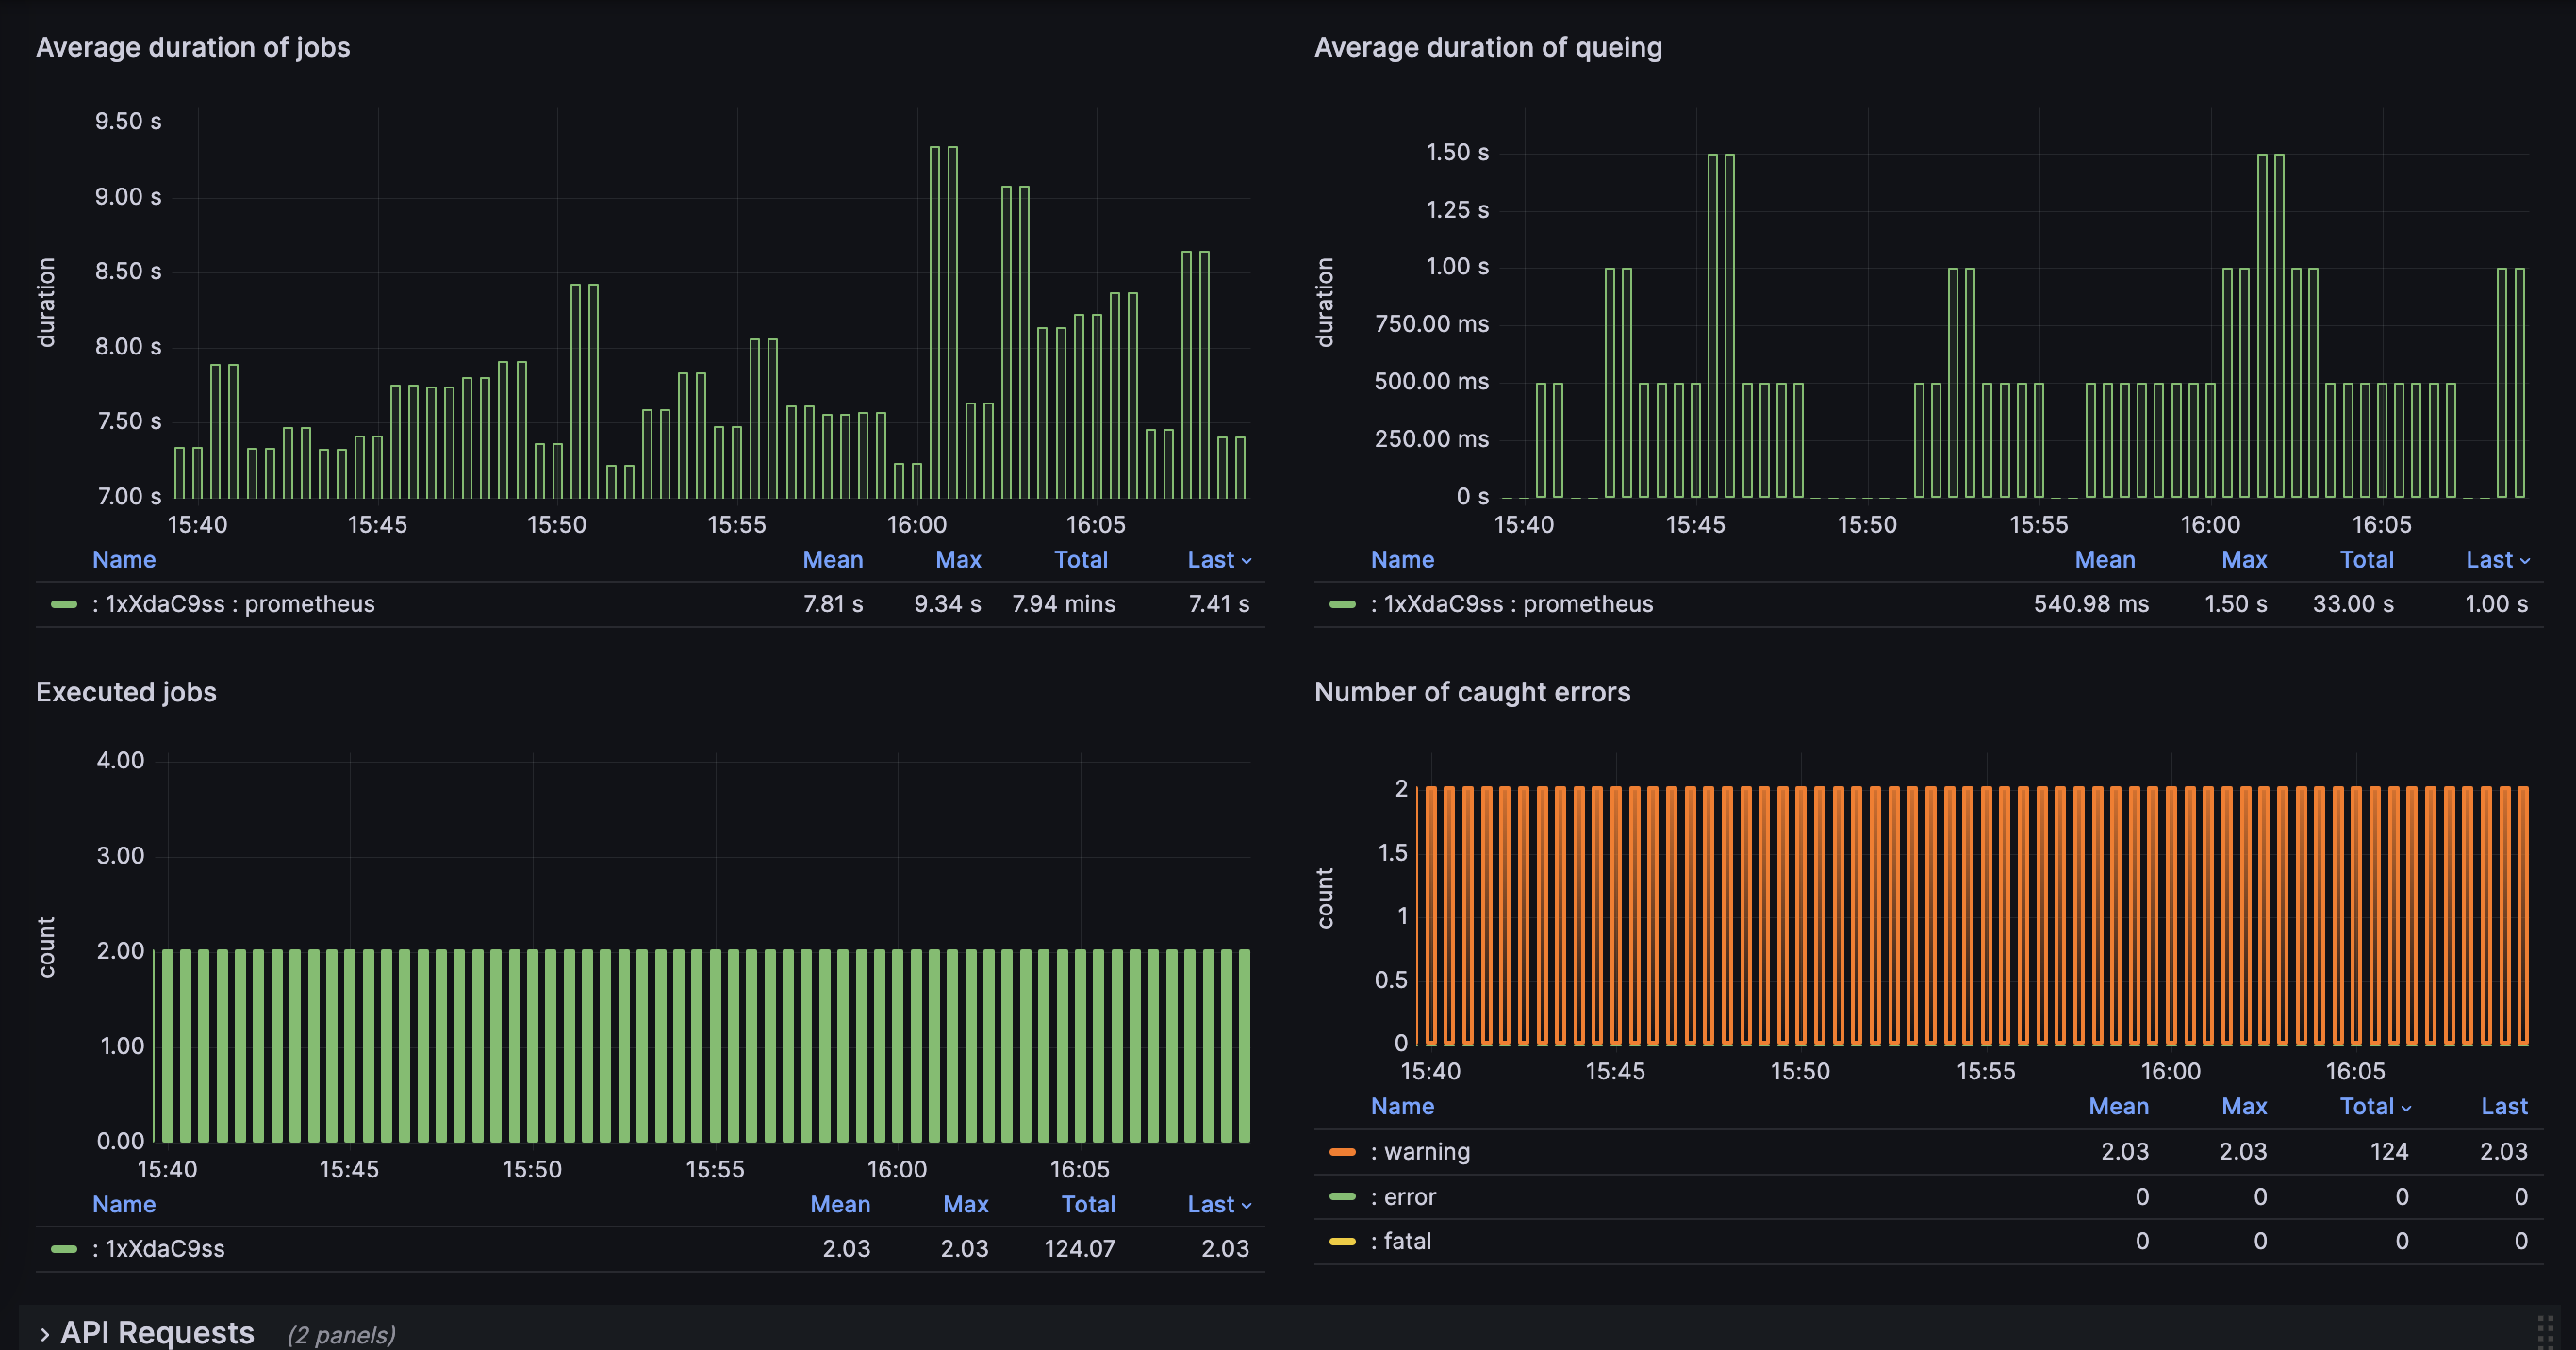
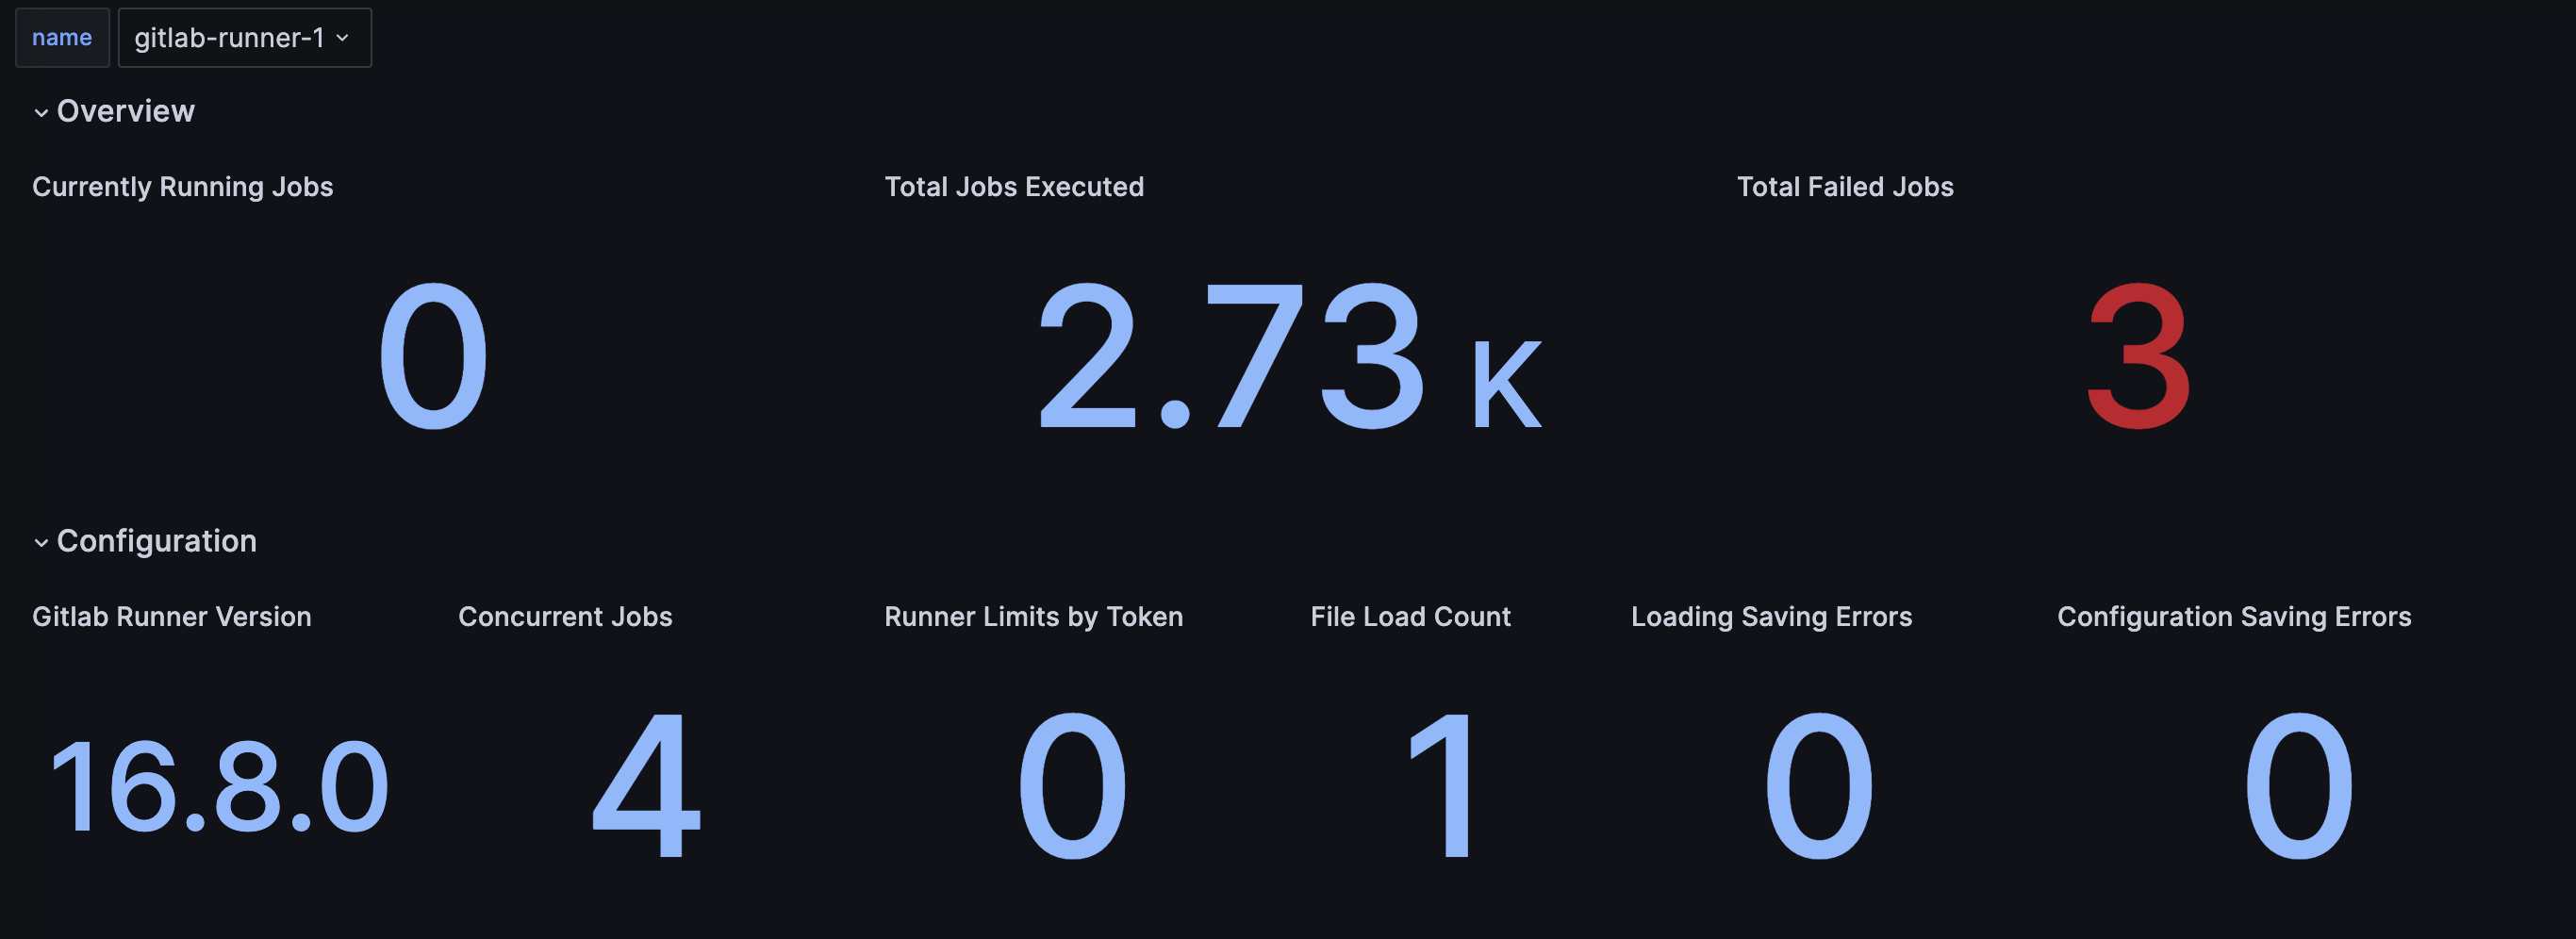
"Gitlab Runner - Docker Executor" is a specialized dashboard designed for monitoring GitLab Runners, specifically tailored for Docker executors, starting from version 16.8. This README provides essential information for using the dashboard effectively.
Prerequisites
- Grafana installed and configured
- Prometheus data source configured
- GitLab Runner metrics exported to Prometheus
Usage
- Ensure that monitoring is enabled in the gitlab runner configuration using the
listen_addressattribute - Ensure that each Prometheus static group contains a
nameattribute to be displayed correctly in this Dashboard.
Example of Gitlab Runner Configuration:
listen_address = ":10000"
concurrent = 4
check_interval = 1
shutdown_timeout = 0
[session_server]
session_timeout = 1800
[[runners]]
name = "my-gitlab-runner"
Example of Prometheus Configuration:
To verify if your Prometheus configuration is suitable for this Dashboard, you can use the following command:
...
scrape_configs:
  # The job name is added as a label `job=<job_name>` to any timeseries scraped from this config.
  - job_name: "prometheus"
    static_configs:
      - targets: ["<IP Address Of The Gitlab Runner>:10000"]
        labels:
          name: my-gitlab-runner
About Us
This dashboard is utilized internally within Cloud-Runner to manage over a hundred GitLab Runners under our management. If you're seeking high-performance and cost-effective GitLab Runners, visit Cloud-Runner.
Data source config
Collector config:
Upload an updated version of an exported dashboard.json file from Grafana
| Revision | Description | Created | |
|---|---|---|---|
| Download |
Docker
Easily monitor Docker with Grafana Cloud's out-of-the-box monitoring solution.
Learn more