ascend-npu-exporter
「Ascend Npu Monitor」 A Grafana dashboard for monitoring Ascend NPU metrics via ascend-npu-exporter. Visualize AI Core utilization, temperature, power, memory, and network status in real time. 基于 ascend-npu-exporter 的昇腾NPU监控面板,支持AI Core、温度、功耗、内存、网络等关键指标的实时可视化。
ascend-npu-dashboard
Grafana Dashboard for Monitoring Ascend NPU Exporter,适用于ascend-npu-exporter监控昇腾AI处理器的Grafana Dashboard 也可以访问github仓库查看最新版ascend-npu-dashboard
1.简介
采用ascend-npu-exporter二进制启动方式监控昇腾AI处理器,数据存储在prometheus中,可下载该面板通过Grafana展示。
2.涉及指标
| 指标名 |
|---|
| 昇腾AI处理器数目 |
| 昇腾AI处理器的AI Core当前频率 |
| 昇腾AI处理器网络健康状态 (仅支持Atlas 训练系列产品 |
| 昇腾AI处理器网口Link状态 (仅支持Atlas 训练系列产品 |
| 昇腾AI处理器网口实时接收速率(仅支持Atlas 训练系列产品) |
| 昇腾AI处理器网口实时发送速率 (仅支持Atlas 训练系列产品) |
| 昇腾AI处理器持续健康状态 |
| 昇腾AI处理器的进程的信息,取值为进程使用的内存 |
| 昇腾AI处理器AI Core利用率 |
| 昇腾AI处理器温度 |
| 昇腾AI处理器功耗(910和310为处理器功耗,310P为板卡功耗) |
| 昇腾AI处理器DDR内存已使用信息 |
| 昇腾AI处理器HBM内存总信息 |
详细指标参见NPU-Exporter Prometheus Metrics接口
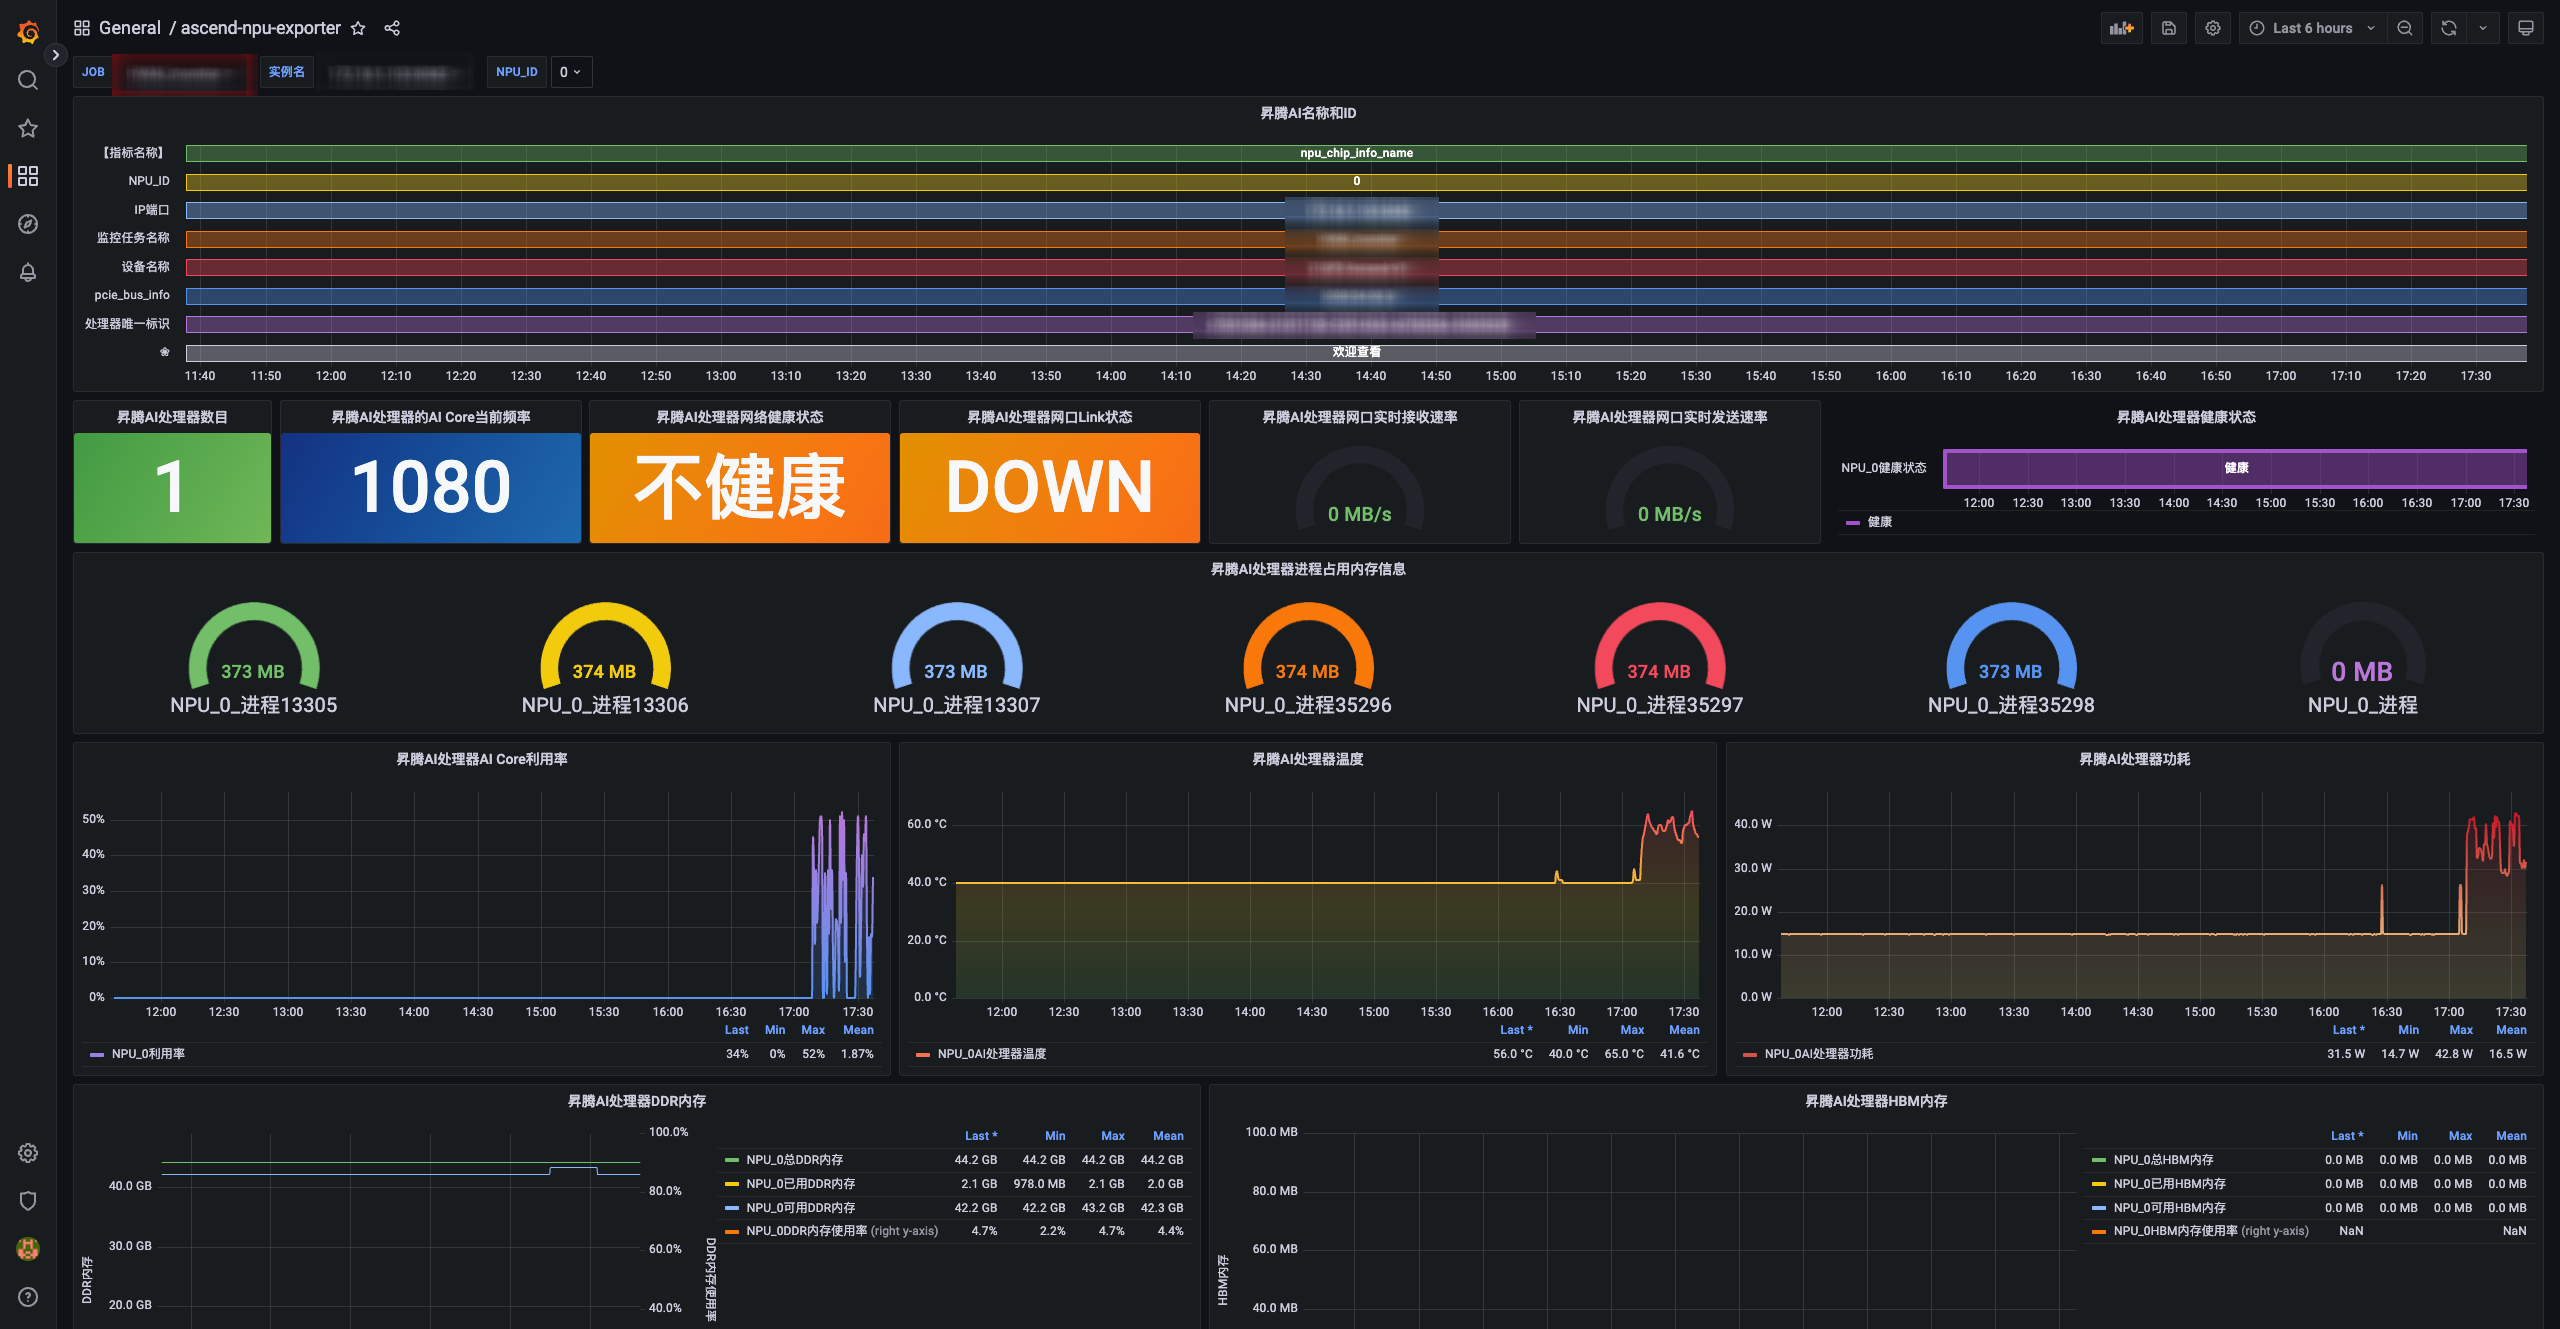
3.截图示例
20240229版本
 20240301版本:调整加速卡信息面板
 20240410版本:监控状态新增“离线”展示

Data source config
Collector type:
Collector plugins:
Collector config:
Revisions
Upload an updated version of an exported dashboard.json file from Grafana
| Revision | Description | Created | |
|---|---|---|---|
| Download |