SolarWinds
Use Grafana PDC for MS SQL Data Source Connectivity: https://grafana.com/docs/grafana-cloud/connect-externally-hosted/private-data-source-connect/
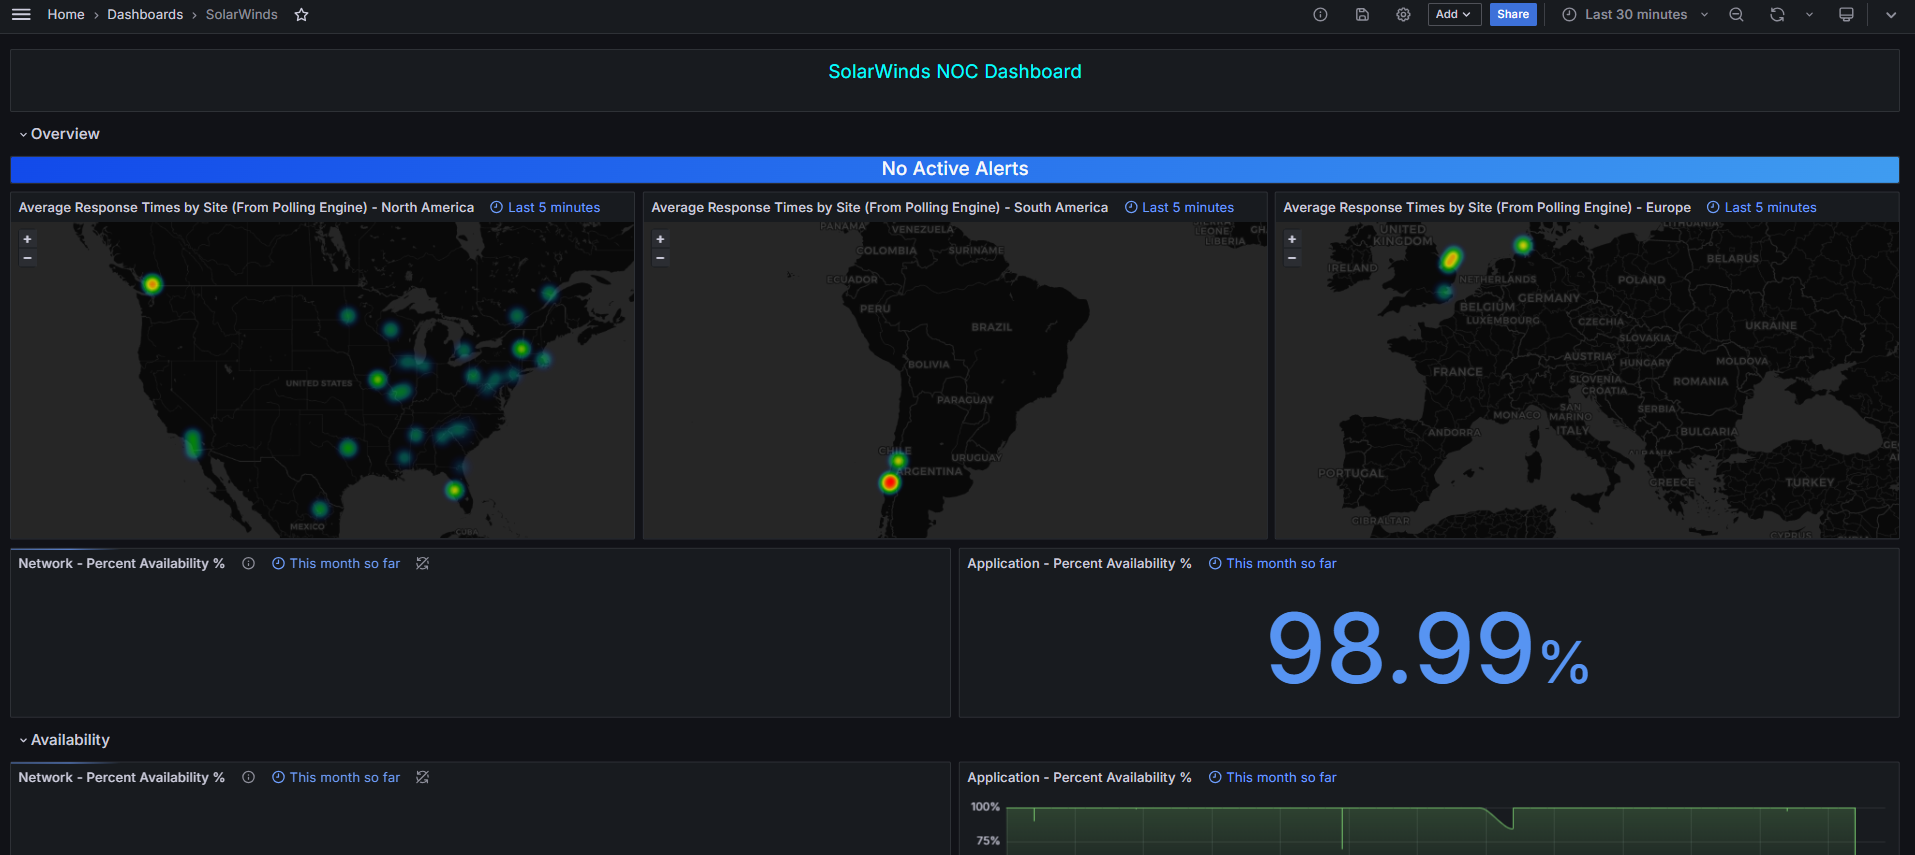
It has been a struggle to find a SolarWinds Grafana dashboard, so I'm uploading mine to help others. Here is an attempt at a first iteration. There are geomaps, time series, and stat panels to paint a holistic view of metrics that SW is collecting via it's MS SQL DB. Visualized Network Availability % (npm) and Application Availability % metrics (sam), with geomaps that display network device response times with a threshold that can be modified in the query. Other metrics for across-the-board Latency and Saturation metrics are also available. chefs kiss to Google's SRE handbook
Here are the steps needed to get this dashboard working correctly:
Deploy Grafana PDC Agent on SolarWinds Server (https://grafana.com/docs/grafana-cloud/connect-externally-hosted/private-data-source-connect/)
Configure MS SQL DB as Data Source, making sure to add PDC connection at the bottom of the data source configuration
Have fun! Modify queries as needed.
Data source config
Collector config:
Upload an updated version of an exported dashboard.json file from Grafana
| Revision | Description | Created | |
|---|---|---|---|
| Download |