OpenTelemetry Collector HostMetrics (Node Exporter)
OpenTelemetry Collector otelcol-contrib hostmetrics (Node Exporter)


OpenTelemetry Collector Contrib HostMetrics (Node Exporter)
Description
otelcol-contrib hostmetrics (Node Exporter)
This dashboard has been adapted for otel from node exporter: https://github.com/open-telemetry/opentelemetry-collector-contrib/tree/main/receiver/hostmetricsreceiver#host-metrics-receiver
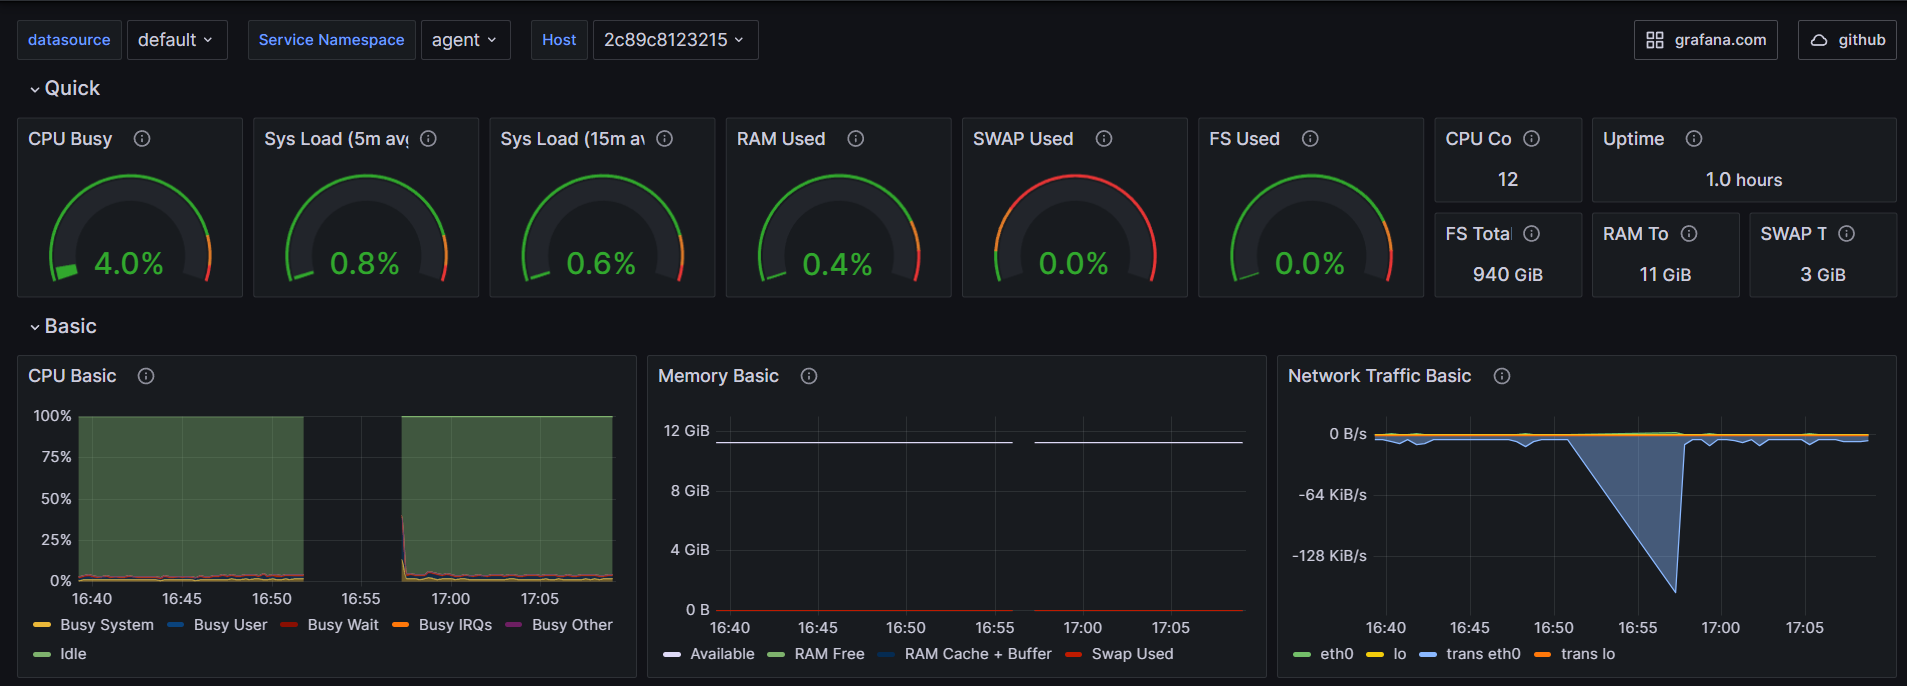
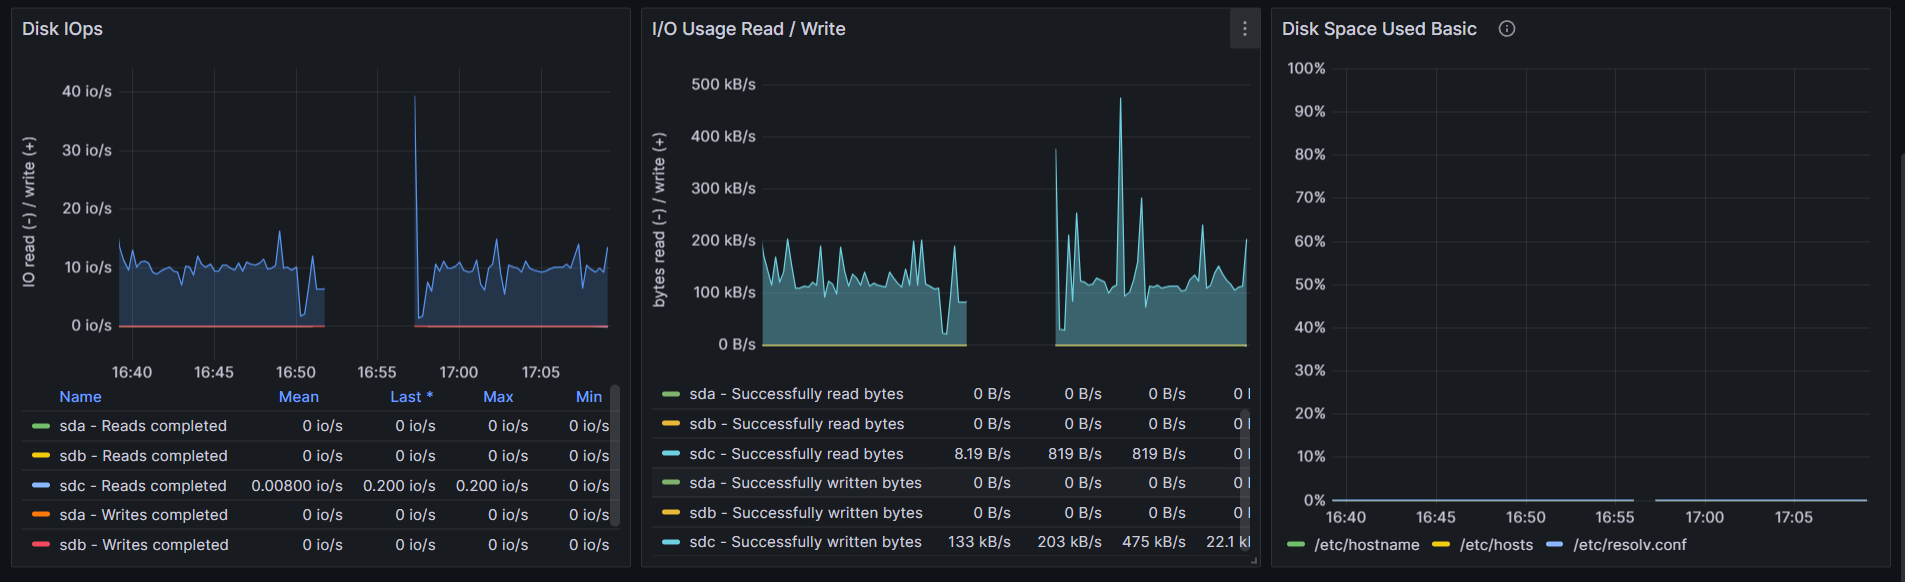
Quick and bacic views
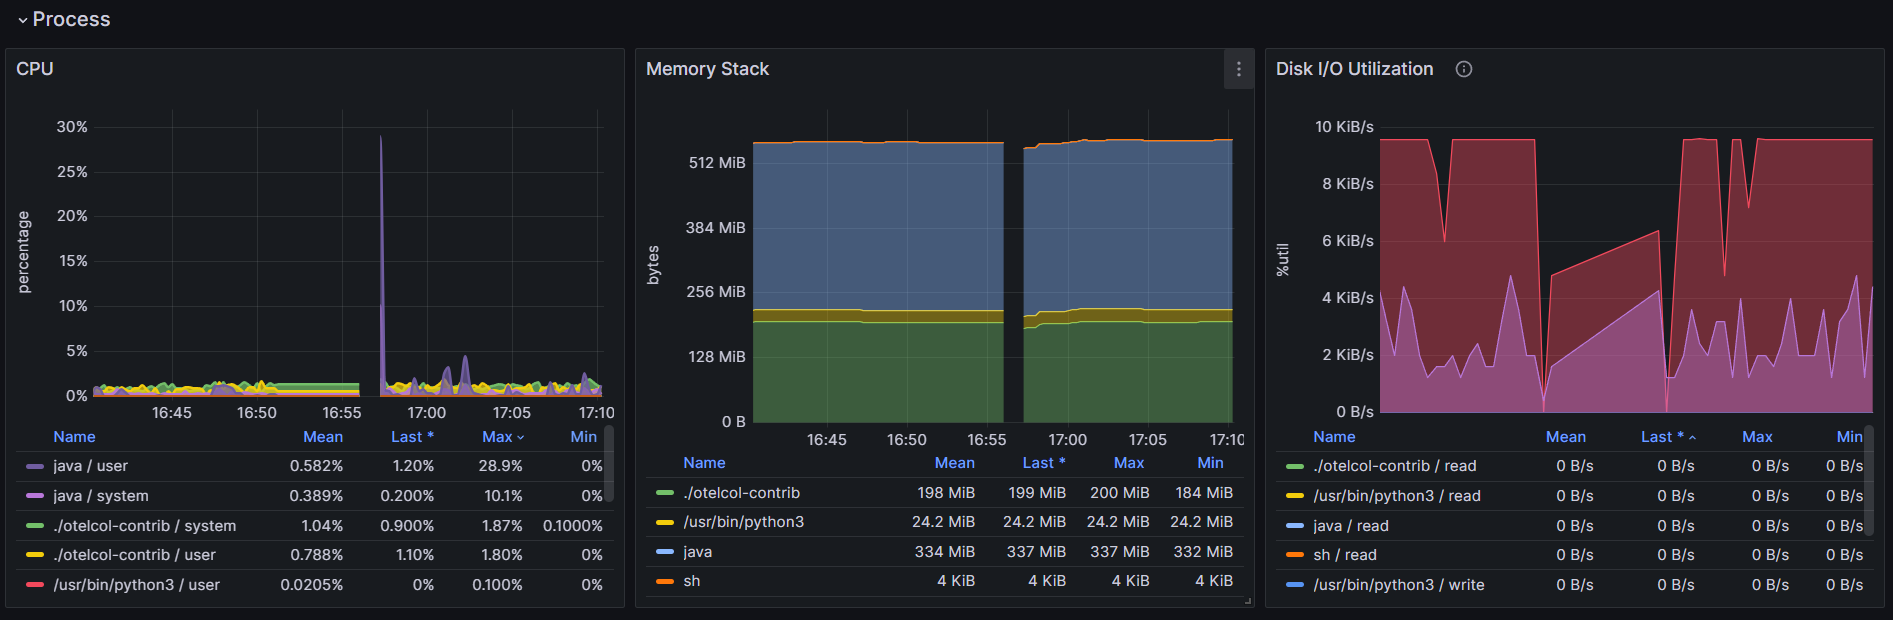
Process metrics
OpenTelemetry Collector Config
exporters:
  otlphttp/mimir:
    endpoint: http://mimir:9009/otlp
receivers:
otelcontribcol metrics + host metrics
prometheus/agent:
config:
scrape_configs:
- job_name: otel-collector
scrape_interval: 10s
static_configs:
- targets: [0.0.0.0:8888]
hostmetrics/agent:
collection_interval: 10s
scrapers:
cpu:
metrics:
system.cpu.logical.count:
enabled: true
memory:
metrics:
system.memory.utilization:
enabled: true
system.memory.limit:
enabled: true
load:
disk:
filesystem:
metrics:
system.filesystem.utilization:
enabled: true
network:
paging:
processes:
process:
mute_process_user_error: true
metrics:
process.cpu.utilization:
enabled: true
process.memory.utilization:
enabled: true
process.threads:
enabled: true
process.paging.faults:
enabled: true
processors:
batch/agent:
resource/agent:
attributes:
- action: upsert
key: service.namespace
value: agent
attributes/agent:
actions:
- key: service.namespace
action: upsert
value: agent
- key: service.name
action: upsert
value: otel-collector
resourcedetection/system:
detectors: ["system"]
system:
hostname_sources: ["os"]
transform:
metric_statements:
- context: datapoint
statements:
- set(attributes["host.name"], resource.attributes["host.name"])
- set(attributes["process.command"], resource.attributes["process.command"])
- set(attributes["process.command_line"], resource.attributes["process.command_line"])
- set(attributes["process.executable.name"], resource.attributes["process.executable.name"])
- set(attributes["process.executable.path"], resource.attributes["process.executable.path"])
- set(attributes["process.owner"], resource.attributes["process.owner"])
- set(attributes["process.parent_pid"], resource.attributes["process.parent_pid"])
- set(attributes["process.pid"], resource.attributes["process.pid"])
service:
telemetry:
metrics:
level: detailed
pipelines:
metrics/agent:
receivers: [prometheus/agent, hostmetrics/agent]
processors: [attributes/agent, resourcedetection/system, transform, batch/agent]
exporters: [otlphttp/mimir]
Data source config
Collector config:
Upload an updated version of an exported dashboard.json file from Grafana
| Revision | Description | Created | |
|---|---|---|---|
| Download |