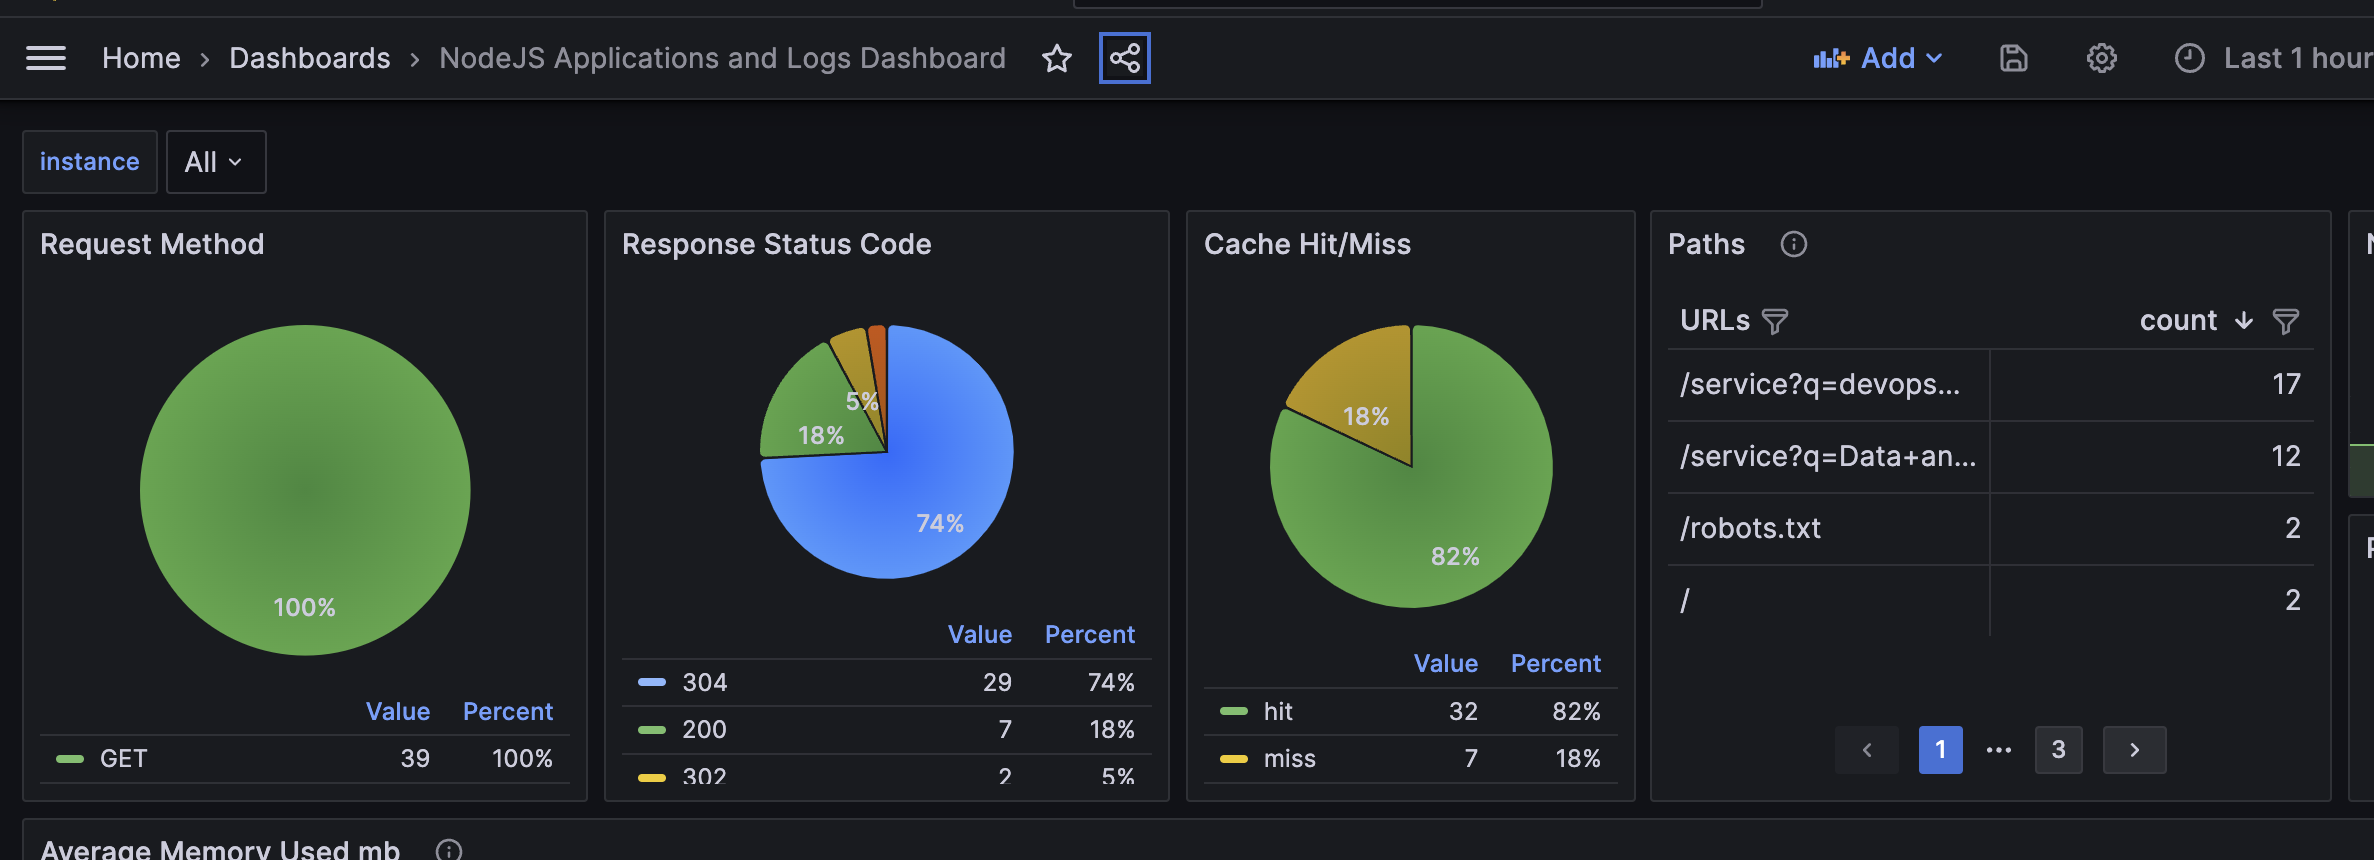
NodeJS Applications and Logs Dashboard
NodeJS Prometheus and Loki client metrics
Grafana and Loki Dashboards
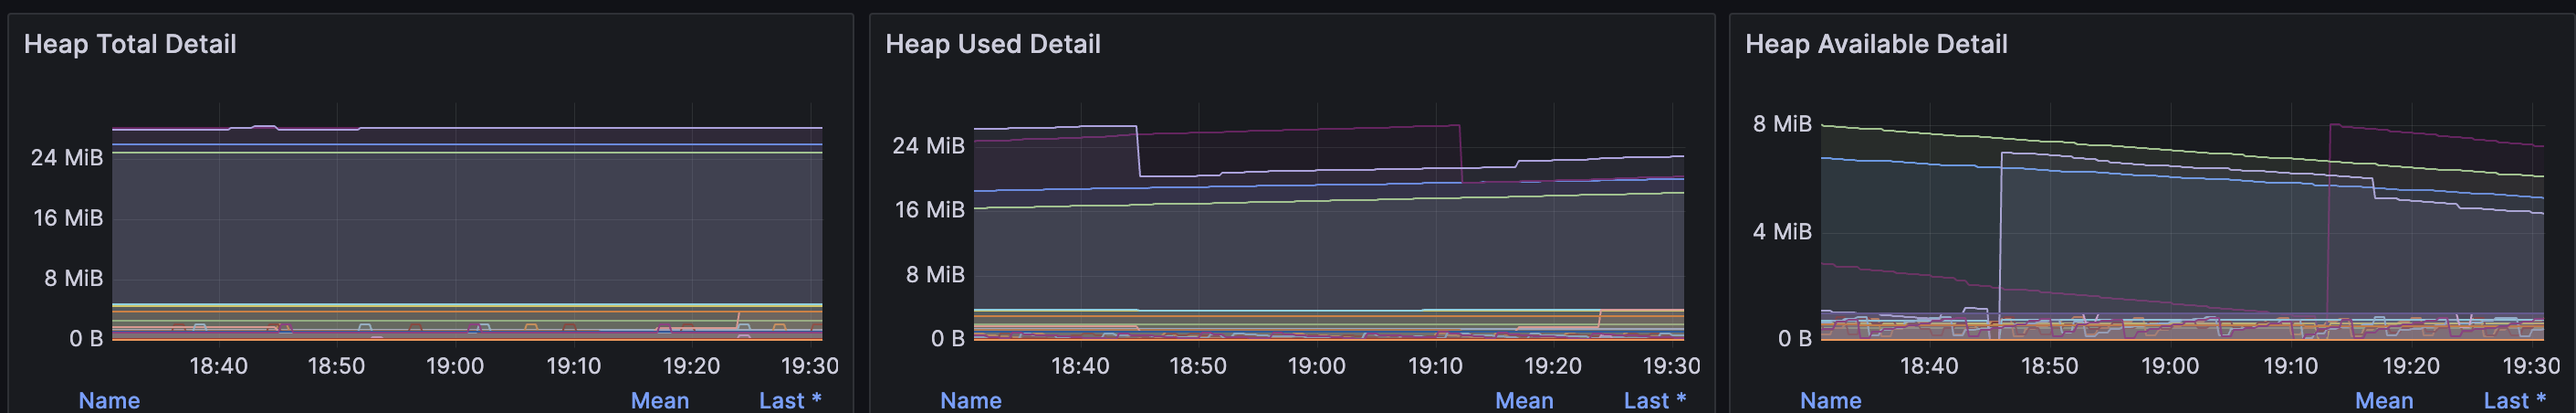
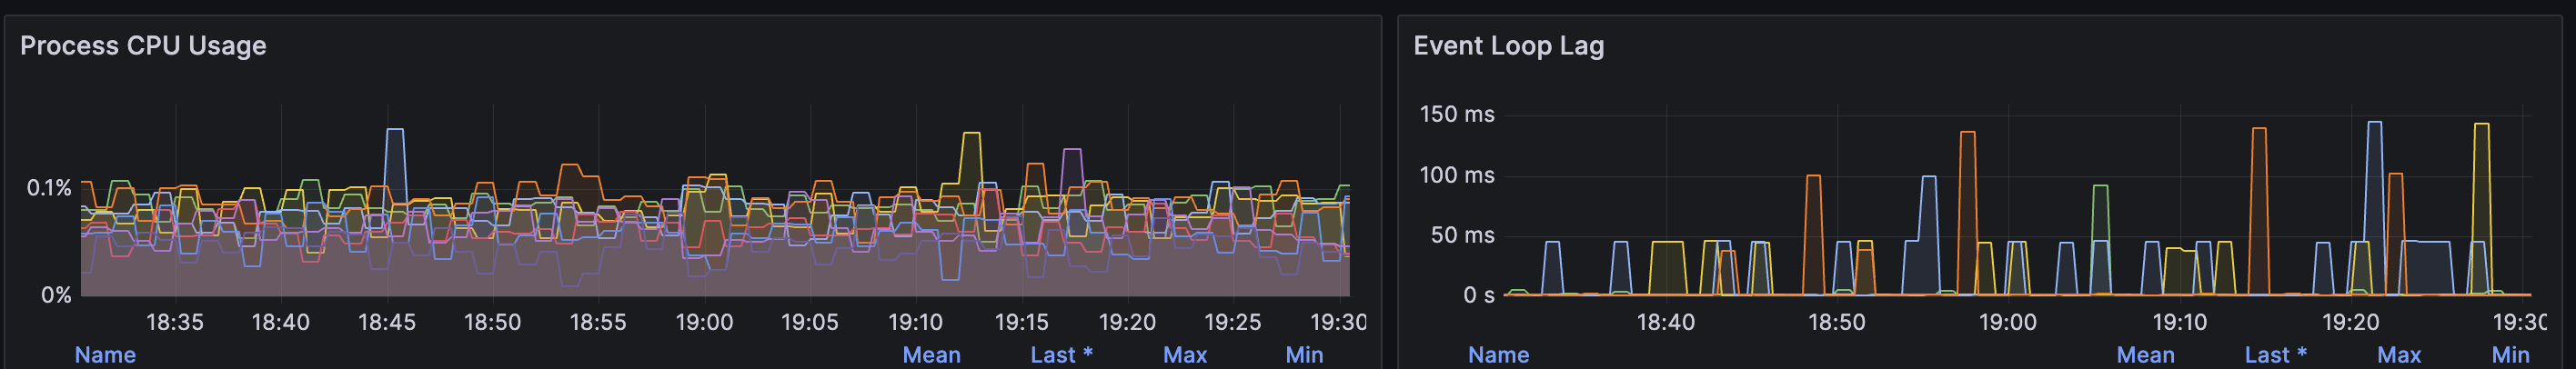
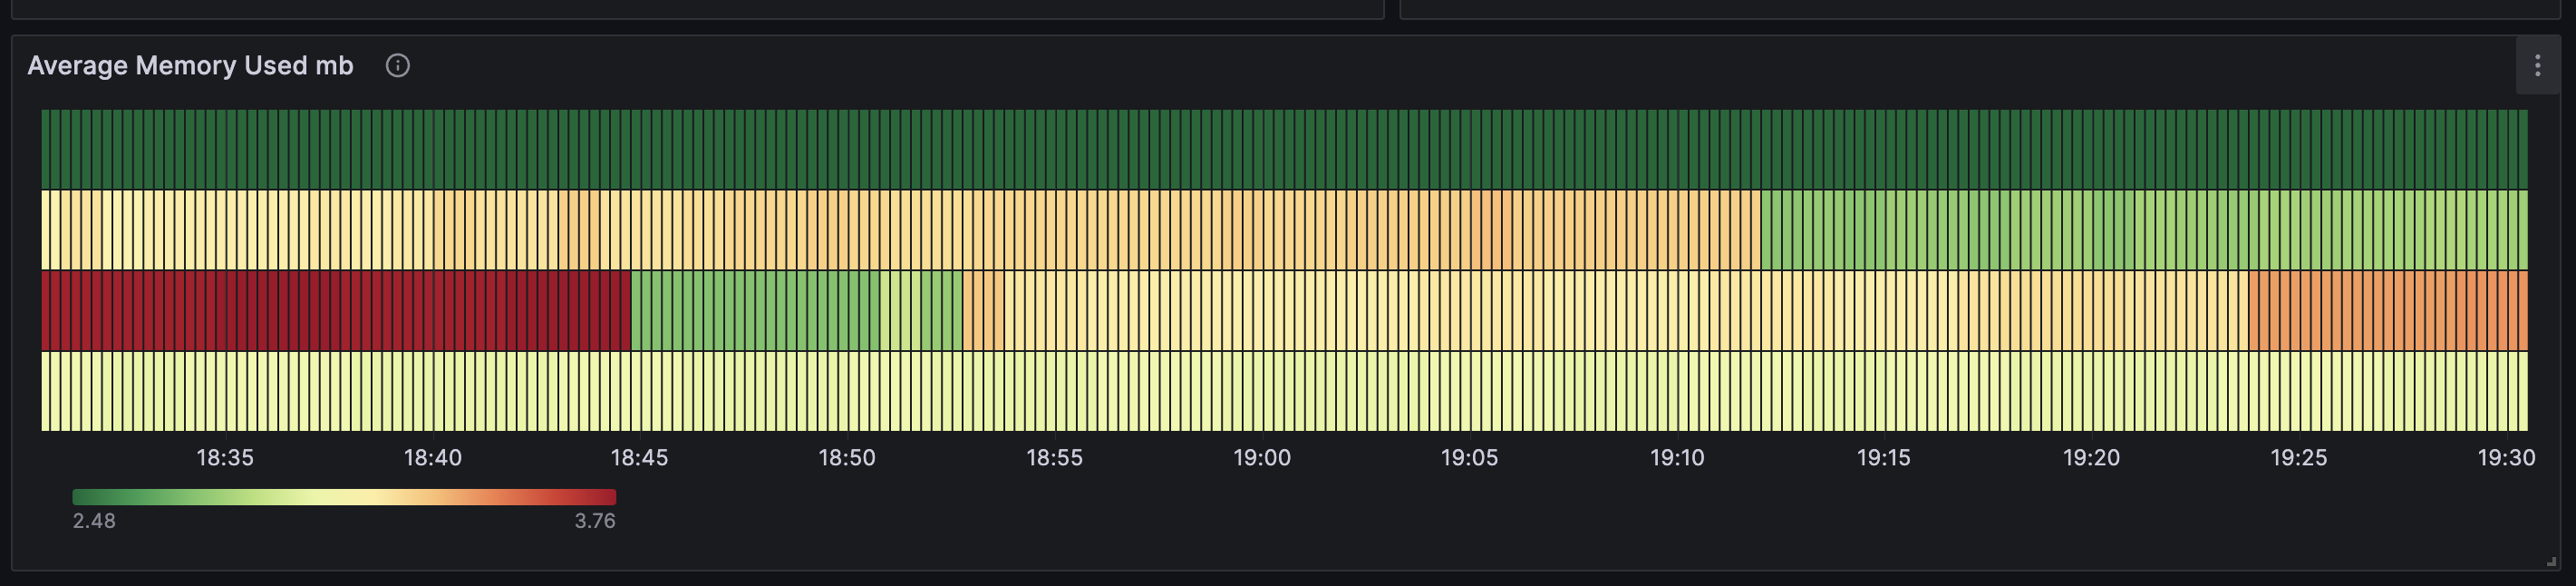
NodeJS prom-client supports a rich collection of prometheus metrics. If you have Prometheus, Loki and Grafana installed on your cluster then prometheus will already be scraping this data due to the scrape annotation on the deployment.
Note
This assumes that you have used Recommended Labels. Make sure you have app.kubernetes.io/name label.
Requirements
- Grafana >= 10.0
Data source config
Collector type:
Collector plugins:
Collector config:
Revisions
Upload an updated version of an exported dashboard.json file from Grafana
| Revision | Description | Created | |
|---|---|---|---|
| Download |
Grafana Loki (self-hosted)
Easily monitor Grafana Loki (self-hosted), a horizontally scalable, highly available, multi-tenant log aggregation system inspired by Prometheus, with Grafana Cloud's out-of-the-box monitoring solution.
Learn more